Semantic Similarity and Correlation of Linked Statistical Data Analysis
- Identifier
- https://csarven.ca/sense-of-lsd-analysis
- Published
- Modified
- License
- CC BY 4.0
- Purpose
- Making “sense” of Linked Statistical Data and Analysis.
Abstract
Statistical data is increasingly made available in the form of Linked Data on the Web. As more and more statistical datasets become available, a fundamental question on statistical data comparability arises: To what extent can arbitrary statistical datasets be faithfully compared? Besides a purely statistical comparability, we are interested in the role that semantics plays in the data to be compared. Our hypothesis is that semantic relationships between different components of statistical datasets might have a relationship with their statistical correlation. Our research focuses in studying whether these statistical and semantic relationships influence each other, by comparing the correlation of statistical data with their semantic similarity. The ongoing research problem is, hence, to investigate why machines have a difficulty in revealing meaningful correlations or establishing non-coincidental connection between variables in statistical datasets. We describe a fully reproducible pipeline to compare statistical correlation with semantic similarity in arbitrary Linked Statistical Data. We present a use case using World Bank data expressed as RDF Data Cube, and we highlight whether dataset titles can help predict strong correlations.
Keywords
Introduction
There was this American who was afraid of a heart attack and he found out that the Japanese ate very little fat and almost did not drink wine but they had much less heart attacks than the Americans. But on the other hand he also found out that the French eat as much fat as the Americans and they drink much more wine but they also have less heart attacks. So he concluded that what kills you is speaking English
[1]. While computers can assist us in discovering strong correlations in large amounts of statistical datasets, whether by chance or through sophisticated methods, humans (or sometimes also known as domain experts) still need to be critical about the results and interpret them appropriately. This implies that we are still very much involved in the process in discovering meaningful correlations by filtering through everything that is presented to us.
If we could however improve the situation slightly by having machines present us with only useful correlations from a random mass of correlations, then we can give more of our attention to what is interesting. Hence, our goal is to set a path towards identifying why some variables have a semantic link between them. Before we establish that, our ongoing approach (as outlined in this research and afterwards) will be to refute or cancel out things which may be in disguise for semantic similarity.
Therefore, we set our investigation with a workflow to experiment with Linked Statistical Datasets in the 270a Cloud [2]. We have first set our hypothesis to uncover the possibility that semantically similar variables or datasets need to incorporate semantically rich information in order to find thought-provoking correlations. Then, the question is, what do exceptional or intriguing linkages for semantic similarity look like? We start with our null hypothesis by checking to see whether the dataset titles in World Bank indicators can help indicate strong correlations. Our results show that dataset titles by themselves or within a particular topic area is not a good indicator to predict correlations.
Methodology
We first state our research design and hypothesis, then discuss how we employed Linked Statistical Data (LSD) and Semantic Similarity approaches for a workflow in our LSD Sense [3] implementation.
Research design
Research problem: Why do machines have difficulty in revealing meaningful correlations or establishing non-coincidental connection between variables in statistical datasets? Put another way: How can machines uncover interesting correlations?
Over this ongoing investigation, we want to uncover some of the fundamental components for measuring and declaring semantic similarity between datasets, in order to better predict relevant strong relationships. Can semantic relatedness between datasets imply statistical correlation of the related data points in the datasets?
Hypothesis
Given our research question, we would like to propose a viable research hypothesis, followed by our investigation with the null hypothesis:
H₁: If the absence of semantically rich connection between datasets is inadequate to distinguish meaningful relationships, then making relevant information about dataset connectivity will improve predicting dataset correlations by observing their semantic similarity.
H₀: There exists a significant relationship between the semantic similarity of statistical dataset titles and the correlation among those datasets, because dataset titles can indicate rich connectivity.
We set the significance level to 5% probability.
Linked Statistical Data and Semantic Similarity
The RDF Data Cube vocabulary does not only allow one to express statistical data in a Web exchangeable format, but also to represent the (semantic) links within those statistical data. This ability poses some new interesting research questions around the relationship between the statistical and semantic relatedness of datasets. We are interested in the interplay of statistical correlation of LSD and their semantic similarity, in order to answer questions like: Does correlation between statistical datasets imply some kind of semantic relation? Do certain semantic links imply the existence of correlation? We propose a generic workflow for studying whether or not this relation between correlation and similarity holds for arbitrary LSD. We aim at generic correlation and similarity measures, and our workflow enables the use of any correlation and similarity indicators. For the specific goal of this paper, though, we stick to the use of Kendall's correlation coefficient and Latent Semantic Analysis (LSA) similarity.
Workflow
Based on preliminary experimentation from data acquisition to analysis, we have created the LSD Sense workflow:
- Create hypothesis
- Determine datasets and configurations
- Get metadata of datasets.
- Get each dataset's observations.
- Create correlations and other analysis for each dataset pair combination.
- Create dataset metadata subset for semantic similarity.
- Create semantic similarity for each dataset pair combination.
- Create correlation and other analysis using variables semantic similarity and correlation of LSD.
- Test and verify hypothesis.
- Analysis.
Implementation
We have an implementation of the LSD Sense workflow which can be used to both, reproduce our experiments, as well as run it on new input datasets. With the exception of determining which datasets to inspect, and the system configuration, LSD Sense is automated.
Semantic Correlation: The semantic similarity algorithm is based on a Latent Semantic Index (LSI) [4]. We use the dataset titles to check for their similarity. Essentially, LSI puts each dataset title into a cluster. The number of clusters can be adjusted (default to 200). It remains as an open research question as to what it should be. Generally, research has demonstrated that optimal values depend on the size and nature of the dataset [5]. We use gensim [6] in our Semantic Correlation [7] implementation for LSD Sense.
Concerning the quality of the dataset titles, it is possible to come across datasets that differ only by one word e.g., male
, female
. This potentially lowers the accuracy to differentiate datasets. As mentioned earlier, we removed the attribute information from the dataset titles with the assumption that it reduced noise.
Experiment
Two experiments were conducted using the same workflow. Experiments differed only by their input data. In the first experiment, the analysis was done for a particular reference year over all available datasets. In the second experiment, however, we restricted the data further for only a particular dataset domain (topic), thereby making it possible to compare whether a control over a topic can be significant for semantic similarity of the dataset titles.
Data
We decided to conduct our experiment on a simple dataset structure, containing two dimensions; reference area, and reference period, and one measure value for its observations, where the World Bank indicators was a good candidate from the 270a Cloud. The rationale for using only one dataspace (at this time) was to remain within a consistent classification space to measure semantic similarity. We fixed the reference period to 2012, and datasets that are part of World Bank's education topic. We have identified one downside concerning the data quality i.e., the attribute/unit information was incorporated as part of the dataset title, usually as a suffix within brackets. We dealt with this by removing the attribute information from the titles as part of preprocessing in the semantic similarity phase.
World Bank Indicators workflow
The workflow of our experiment is summarized as follows:
Correlations for each dataset pair
We retrieved the 2012 World Bank Indicators datasets, 3267 in total, via SPARQL queries from the World Bank Linked Dataspace [8]. The correlations were computed using R, the statistical software, by joining each dataset pair by their reference area (one of the dimensions of the dataset structure), and using their measure values for the correlation coefficient. Based on preliminary inspection for normality distribution on sample datasets, we noted that observations did not come from a bivariate normal distribution. Hence, we computed Kendall's rank correlation coefficient in our analysis. Initially we computed and stored the correlations for dataset pairs with a sample size, n>10, resulting in 2126912 correlation values. The information on the analysis we generated consisted of the following headers: datasetX, datasetY, correlation, pValue, n, where datasetX and datasetY are the identifiers for each dataset pair that is being compared. We later filtered sample values, n<50, for our threshold for significance. The population size i.e., the number of potential reference areas that can have an observation, is 260. That is the number of reference area codes in the World Bank classification, however, it is not known as to which reference areas may occur in a given dataset beforehand. We retained majority of the computations in any case, giving us the possibility to do better pruning in the future, in light of more information.
Semantic similarity for each dataset pair
Before doing the semantic similarity, we first took an unique list of the dataset identifiers from datasetX and datasetY so that what is to be checked for their similarity is only in relation to those datasets, as opposed to the complete set of datasets which we originally retrieved. At this point, we have 2200 unique datasets. The similarity was measured based on dataset titles. They are in short sentences e.g., Mortality rate, infant (per 1,000 live births)
. After minor preprocessing e.g., removal of the text pertaining the unit within brackets, it was left with Mortality rate, infant
. The semantic similarity algorithm is based on LSA. Essentially LSA puts each dataset title into a cluster (default number is 200). The resulting headers of the output was: datasetX, datasetY, similarity.
Correlation analysis with variables semantic similarity and correlation of dataset
We then took the absolute values for both variables; |similarity|, |correlation| (caring only for the strength of the relationships as opposed to their directionality). We then filtered both similarity and correlation values <0.05 and >0.95, as well as correlation values with p-value>0.05, for reasons to exclude potential outliers, or misleading perfect relations, as well as to exclude insignificant correlations. The final correlation and scatter plot was generated by joining the similarity and correlation tables on datasetX and datasetY columns. Finally the correlation of the final data table was conducted using the Kendall method as the data had a non-normal distribution and we were not interested in modeling (line fitting).
The second experiment followed the same procedure for the analysis, but considering only the datasets associated with the topic education for the same reference period.
Results
All of the experiment results are available at the LSD Sense GitHub repository, and can be reproduced. Table [Experiment results] provides our findings, with Figures [1] and [2]:
| All topics | One topic (education) | |
|---|---|---|
| Datasets are from 2012 World Bank indicators. n is the number of dataset pairs with semantic similarity and correlation as variables. | ||
| Correlation | 0.182 | 0.227 |
| p-value | < 2.2e-16 | < 2.2e-16 |
| n | 92819 | 33184 |
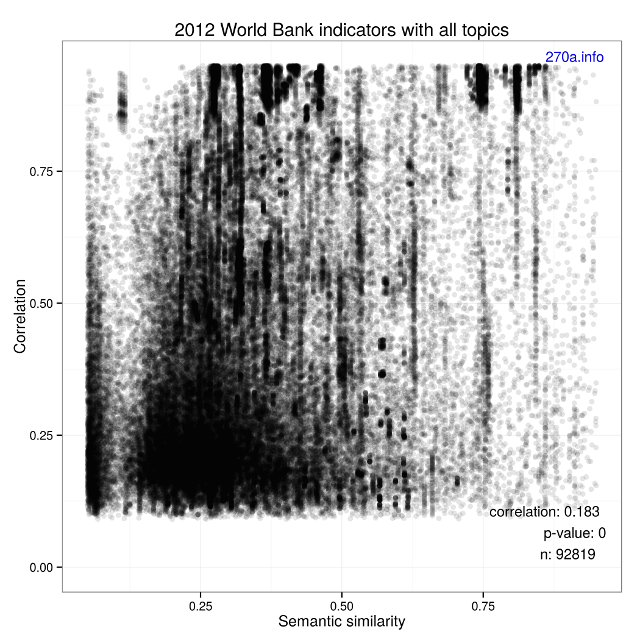
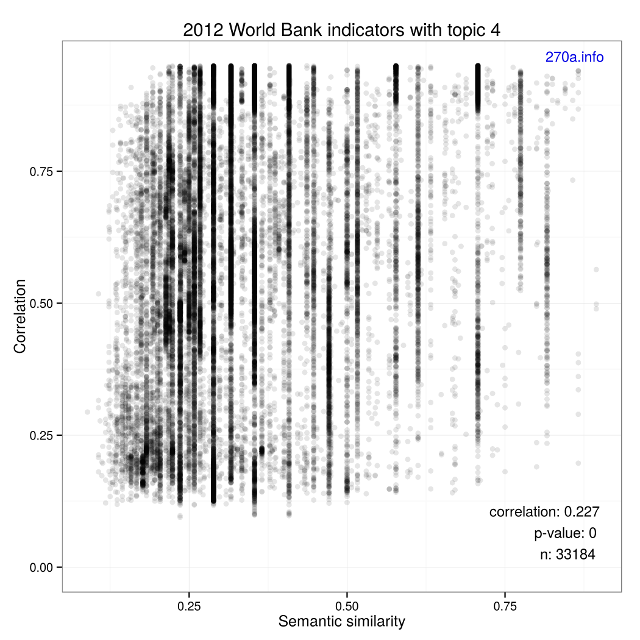
Given that both experiments resulted in p-values that are statistically significant and that the strength of the correlation values are weak, we reject our null hypothesis. For extra measure, we can also verify the meaninglessness by looking at the plots. There is nothing interesting to see here. We will move along with our alternative hypothesis.
Conclusions and Future Work
We believe that the presented work here and the prior Linked Statistical Data Analysis effort contributes towards strengthening the relationship between Semantic Web and statistical research. What we have set out to investigate was to minimize human involvement for discovering useful correlations in statistical data. We have implemented a workflow in which we can automate the analysis process, from data retrieval to outputting analysis results for candidate semantic linkages in Linked Statistical Data.
We have evaluated our results by testing and verifying the null hypothesis which we have put forward. While it turned out that the semantic similarity between datasets titles were not useful to determine strong and meaningful correlations — which is a useful finding, in any case — it left us with the remaining alternative hypothesis that can be used in future research.
Possibly fruitful future work might want to run a similar experiment with the semantic similarity of dataset descriptions, test manually configured useful relations for a controlled set of datasets, or looking into interlinked topic domains across linked dataspaces.
Where is interestingness hidden?
Acknowledgements
This work was supported by a STSM Grant from the COST Action TD1210. Many thanks to colleagues whom helped one way or another during the course of this work (not implying any endorsement); in no particular order: Amber van den Bos (Dakiroa), Michael Mosimann (BFS), Anton Heijs (Treparel b.v.), Frank van Harmelen (VU Amsterdam).
References
- Rosling, H., Marmot, M.: The Joy Of Stats: Meaningless and meaningful correlations, http://www.open.edu/openlearn/science-maths-technology/mathematics-and-statistics/statistics/the-joy-stats-meaningless-and-meaningful-correlations
- 270a.info, http://270a.info/
- LSD Sense code at GitHub, https://github.com/csarven/lsd-sense
- Deerwester, S., Dumais, S. T., Furnas, G. W., Landauer, T. K., Harshman, R.: Indexing by Latent Semantic Analysis, Journal of the American Society for Information Science, 41(6), pp.391–407 (1990), http://www.cs.bham.ac.uk/~pxt/IDA/lsa_ind.pdf
- Bradford, R.: An Empirical Study of Required Dimensionality for Large-scale Latent Semantic Indexing Applications, Proceedings of the 17th ACM Conference on Information and Knowledge Management, pp.153–162 (2008), http://dl.acm.org/citation.cfm?id=1458105
- gensim: Topic modeling for humans, http://radimrehurek.com/gensim/index.html
- SemanticCorrelation code at GitHub, https://github.com/albertmeronyo/SemanticCorrelation
- World Bank Linked Dataspace, http://worldbank.270a.info/
- Capadisli, S., Auer, S. Riedl, R.: Linked Statistical Data Analysis, ISWC SemStats (2013), https://csarven.ca/linked-statistical-data-analysis
- stats.270a.info, http://stats.270a.info/
- McCusker, J. P., McGuinness, D. L., Lee, J., Thomas, C., Courtney, P., Tatalovich, Z., Contractor, N., Morgan, G., Shaikh, A.: Towards Next Generation Health Data Exploration: A Data Cube-based Investigation into Population Statistics for Tobacco, Hawaii International Conference on System Sciences (2012), http://www.hicss.hawaii.edu/hicss_46/bp46/hc6.pdf
- qb.js, http://orion.tw.rpi.edu/~jimmccusker/qb.js/
- Paulheim, H.: Generating Possible Interpretations for Statistics from Linked Open Data, ESWC (2012), http://www.ke.tu-darmstadt.de/bibtex/attachments/single/310
- Zaveri, A., Vissoci, J. R. N., Daraio, C., Pietrobon, R.: Using Linked Data to Evaluate the Impact of Research and Development in Europe: A Structural Equation Model, pp.244–259, ISWC (2013), http://svn.aksw.org/papers/2013/LODSEM/ISWC2013_AZ_LODSEM_public.pdf
- Vigen, T.: Spurious Correlations, http://tylervigen.com/
- Shvaiko, P., Euzenat, J.: Ontology matching: state of the art and future challenges. IEEE Transactions on Knowledge and Data Engineering (2013), http://disi.unitn.it/~p2p/RelatedWork/Matching/SurveyOMtkde_SE.pdf
Interactions
10 interactions
 Tom Passin replied on
On reading the paper, I see you tried to do on a large scale much what I did on a small scale in 2003, namely, to get some mileage out of titles only. I found a way to enhance the semantic content of these particular titles (browser bookmarks). I found the approach to be of value in retrieval. You might like to read my paper on this, "Browser bookmark management with Topic Maps", at
http://conferences.idealliance.org/extreme/html/2003/Passin01/EML2003Passin01.html
I also played with a very different title clustering method, and you might like reading that work, too:
"On-the-fly Clustering As A Novel RDF Query Mechanism" at
http://conferences.idealliance.org/extreme/html/2004/Passin01/EML2004Passin01.html
Tom Passin
 Stian Soiland-Reyes replied on
Thanks for publishing your negative results; I wish more people did! This article also clearly detail your methodology and hypothesis, in addition to providing source code and data.
One thing - intermediate values? (I am a provenance guy after all..) I browsed through the github source, but was unable to find the source data after cleaning/preprocessing - I wanted to verify how much remained after stripping out units etc.
1 interaction
 Sarven Capadisli replied on
Thanks Stian. The source data was too big to include at GitHub. I could offer it up on this site I suppose.
What I'm actually planning to do is simply referring to the analysis and provenance (activity) URIs instead at stats.270a.info.
The source data can still be produced by running the scripts (hopefully nothing goes chaos on your end) :)
 Paul Groth replied on
Sarven asked me to review this work. Here are my comments:
Overall, an interesting analysis and direction. It’s also of compelling in terms of the underlying linked data approach to making the article itself. First some thoughts on the presentation of the research itself. I think in general the key issue I had is being more precise about the research goals.
The key question I had was what constitutes interesting/useful correlations? This is central to the paper and I’m not clear what this means.
- “The ongoing research problem is, hence, to investigate why machines have a difficulty in revealing meaningful correlations or establishing non-coincidental connection between variables in statistical datasets.” -> How is this a research problem?
- “refute or cancel out things which may be in disguise for semantic similarity.” - what does this mean?
- Why don’t you state your research problem using the more simple version: How can machines uncover interesting correlations?
- I don’t know what Hypothesis 1 means? Aren’t you just trying to say that your hypothesis is that “Semantic similarity is a good predictor of meaningful correlations”.
- “Linked Statistical Data and Semantic Similarity” - is lucid and probably a better introduction to what you want to do than what came before it.
Thoughts on reproducibility
- It would be nice to get some interactions on what to run.
- Maybe some setup or pull scripts? Would love to just be a able to git clone and run… I’m a fan of vagrant or other lightweight VMs
- What are your thoughts on supporting content negotiation?
- Could you link from the workflow processes to the github code?
Stuff I can do with your paper which is cool:
Assume:
rapper -i rdfa https://csarven.ca/sense-of-lsd-analysis > lsd.nt
Find we what the problem statement is:
roqet -i sparql -e "select * where {?s <http://www.w3.org/1999/02/22-rdf-syntax-ns#type> <http://purl.org/spar/deo/ProblemStatement>}" -D lsd.nt
List the steps in the research:
select * where {?s <http://www.w3.org/1999/02/22-rdf-syntax-ns#type> <http://www.opmw.org/ontology/WorkflowTemplateProcess>
List the contributors
roqet -i sparql -e "select * where {?s <http://purl.org/dc/terms/contributor> ?o}" -D lsd.nt
Unfortunately, they don’t all have rdfs:labels.
Overall, it really shows what you can do with these technologies.
Layout
- Section numbering would be nice.
- Linking to sections. It would be nice to provide some winerlinks.
- It would be nice if I could click on the figures to zoom in to them and also link directly back to the directory.
- I would ensure that the datasets are identified and referenced (if possible) from the text.
Minor Comments
- “to discover” —> in discovering
- “before hand” —> “beforehand”
- “The RDF Data Cube vocabulary does not only allow to express statistical data in a Web exchangeable format” -> “not only allow one to…”
Anonymous Reviewer replied on
The basic idea in the paper is good. Determining the effectiveness of links in LOD is very important. I like the way the paper is written; the style is informal. The main conclusion, though negative, is important. In fact, too few papers advance our understanding by reporting negative results. This paper is a nice exception.
I found the procedure, written in the abstract, hard to follow. In addition, there were few concrete examples of the results of the procedure to illustrate the process. It seems to me an example illustrating each step of the process needs to be added. I expect this may add one or at most 2 to the length, certainly a tenable addition.
The introductory joke at the start of the paper was a welcome surprise. Usually, authors sound so serious, and I found this style made me want to continue. Unfortunately, I found the presentation a little rough. In addition to the lack of example cited above, some areas need a sentence or two more explanation. For instance, LSI may not be known to all readers. The reference is good, but if you say a sentence about what it does or accomplishes, why it is relevant to the study, then that puts the unfamiliar reader at ease. (S)he can check the reference later. Otherwise (s)he is forced to in order to continue reading. Similarly, LSD Sense is not defined. The reference indicates there is code on a Github site. You need to devote a paragraph to what this (LSD Sense) is and does.
Relevant also to the lack of examples, it is not at all clear how the elements in the Data Cube vocabulary are used in the experiment. Similarly, the World Bank list of indicators data sets is not spelled out or illustrated.
Basically, you looked at data set names. Give some examples!
What are the reference areas, reference periods, and values you considered? These are left to the reader to guess.
You need to have a full set of examples illustrating the problem, the procedures, and the results.
Anonymous Reviewer replied on
The subject of the paper, exploring dataset titles for similary of datasets, seem to be questionable. Looking at titles - for comparison purposes - is a very poor means. If this is done, then it would only make sense, if nothing else is available. But this was not mentioned in the paper.
A dataset, which claims to have some value, has more information than just a title. It has a dataset description and much more descriptive information. Here, data in the form of data cubes are explored. Then definitions of dimensions and code lists are available. Exploring these definitions and codelists has much more value for comparison purposes. The whole exercise of the paper should be applied to this area.
Comparison is usually mainly done on the basis of similar or equal definitions of variables (microdata) or dimensions(aggregate data).
Some details: Statistical and semantic comparability are mentioned but not clearly described what it is meant in this context.
Regarding the subject: I would like just to underline that a dataset, which claims to have some value, has more information than just a title. Then this additional information should be used for any usage.
Using datasets (especially in comparison) just according to titles without having information available like a description of the data or definitions of the columns/variables is questionable. It doesn't seem to make sense because the data is generated to describe something. But with poor information on the data one doesn't know what the data describes. That means one does speculations. Does this make sense? Comparison of data is a rather complicated animal. It is necessary to understand the data. This could be the basis for comparison.
Comparison approaches should really more focus on descriptions/definitions of the data respectively the columns/variables which are the compounds of the data.
Any work on just the titles seems to focus on something which can be done indeed but it doesn't focus on something which really makes sense in a general way. This type of work could only make sense if one has no other information available than titles. Then this approach can be used to decipher the object of which the data describes. But one has to be aware that even then the understanding is very limited.
Anonymous Reviewer replied on
Semantic similarity and statistical correlation is an age-old problem, and it is an interesting idea to tackle it in the linked data context. But there are so many pitfalls in this area that you have to be very precise and careful. The problem here is that I simply cannot understand the formulation of the work hypotheses in 2.2. The notion of "semantic similarity between datasets" should be defined, because it makes no sense to me.
The description of the workflow is too sketchy, and the results section is too short (and the figures not legible.)
In short: interesting topic, but the paper is not finished. I will be happy to give a better evaluation when it is more complete.
Armin Haller replied on
I think there are two main problems, why the reviews weren't that great. The first is the Hypothesis is unclear/semantically wrong "If the absence of semantically rich connection between datasets is inadequate". There is some double negation in there which I don't understand and which I think non of the reviewers understood (even though we can guess what you meant). The second problem was the lack of examples. Dataset titles is broad and you did not provide a definition of what are your titles (sub-datasets are included?) and what did you use, the labels, the URI, and why not a bit more than just the titles? It may have been more meaningful to extract some keywords from the title, the description and especially the DTDs. Just on the titles seems a bit restrictive. I know it is a workshop paper, but the reviewers probably thought from the beginning that based on the titles there wouldn't be much overlap/correlation.
I really like the idea, though, and even though the last reviewer pointed out that semantic similiartiy and statistical correlation is an age-old problem, I have not seen a single paper doing that in our domain. What if you enlarge the correlation analysis with the DTDs. I think that would make it a lot more convincing and might even result in not rejecting your null hypothesis. Also, why not doing it on more datasets? You probably don't have enough datasets in one domain, I guess? Happy to contribute to that. Also, including some of the ABS datasets might make it even better.
 TM replied on
I'm confused by your hypothesis test. You specify H0 as "There exists a significant relationship" etc. You did find a strong statistical relationship (p-value < 2.2e-16). You then comment: "Given that both experiments resulted in p-values that are statistically significant and that the strength of the correlation values are weak, we reject our null hypothesis."
I have never seen a hypothesis test like that. What would it have taken to not reject the hypothesis?
Regarding your research question (as far as I understand it), I find it difficult to make sense of. Why should we care whether correlated datasets have similar titles? Sure, it wouldn't be surprising to find that male and female literacy rates are correlated, but then what? What non-obvious insight do we derive from that observation? On the other hand, if we want to causally explain those literacy rates and why they differ for different regions/demographics, we would surely have to investigate variables related to economic and social development and there is no reason whatsoever to expect that the relevant explanatory variables will be semantically similar to the variables we attempt to explain.
TM replied on
Addendum: It is also bewildering that several commenters describe this as a "negative result". In standard statistical terminology, rejection of the null hypothesis is a positive (i. e. interesting, unexpected) result.