Statistical Linked Dataspaces
- Purpose
- Submitted in fulfilment of the requirements for the degree of Master of Science.
- Organisation
 Digital Enterprise Research Institute
 National University of Ireland, Galway
- Date submitted
- 2012-07
Abstract
Statistical data, in particular official statistics published by government agencies, often provide the basis for policy making and business intelligence tasks. Linked Data, by virtue of using Web standards, provides for setting typed links between data items in different data sources, thereby connecting these sources into a single global dataspace. Taken together, the question at hand now is how to approach the design and implementation of a statistical Linked Dataspace and to identify the particularities of it.
Initially, the thesis presents a connection between the general concept of a dataspace as introduced by Franklin et. al. and a Linked Dataspaces as well as proposes an architecture for a Linked Dataspace. Then, based on the analysis of three case studies (Irish Census 2006, Eurostat, and World Bank), it derives requirements for the implementation of such a dataspace. This forms the first core contribution of the work.
In the process of deploying statistical Linked Dataspaces we have identified the necessary components and also gaps in the tool support concerning certain phases of Linked Data life cycles, which led to the development of two tools, representing a core contribution of the thesis: i) GraphPusher, a tool that automates bulk data loading into an RDF store based on a dataset description, and ii) Linked Data Pages, a publishing framework that provides for templated, visual rendering of the data. Additionally, again based on the deployment experience of the above mentioned three statistical data sources as Linked Data, lessons learned and best practices around the topics of data retrieval, conversion, modeling, enrichment and publishing are presented, which constitutes another contribution of said work.
As statistical data is inherently highly structured and comes with rich metadata (in form of code lists, dictionaries, etc.) we found certain areas that deserve particular attention when implementing a statistical Linked Dataspace, including the ability to deal with large-scale RDF data (due to the high number of observations in the data), and the challenge of visualization and interaction with the data.
Document Identifier
https://csarven.ca/statistical-linked-dataspaces
License
Acknowledgements
¸ø•*`*•ø¸ø•*`*•ø¸ø•*`*•ø¸ø•*`*•ø¸¸ø•*`*•ø¸¸ø•*`*•ø¸ø•*`*•ø¸ø•*`*•ø¸ø•*`*•ø¸¸ø•*`
                 _
               .' \ __/7 _    _      /7__ _//_  ___    ___   /7__
              / o ,',//_/ \/,'o/7/7//,'o,'o,'o,'o/ \','o/ \//_(c'
             /_n_/\_//\/_n_/|_,|,^,//|_|__/|_,|_/_nn_|_/_n_///__)
                                           _//

Shout outs go to:

           · DERI · #swig · #jena · #talis · AKSW · GLD-WG · u+270a ·
        · tobyink (the gangster that sold me the Linked Data kool-aid) ·
                  · sheilagreaney · zyonnnn · belakv · iammyr ·

So many to thank, so little space, so:

I would like to express my gratitude to my supervisor, Michael Hausenblas,
whose expertise and guidance added considerably to my graduate experience.
The fact that he was able to handle a big kid like me without losing his cool,
should be written in the history of student-supervisor relationships.
Thank you Michael for inviting me to DERI and giving me the opportunity
to work with you.

Richard Cyganiak deserves a category on all of his own. I have learned a lot
from Richard through our discussions over the course of two years. He was able
to eloquently shed light on various topics in Linked Data whenever I poked him
for random conversations. When in need to commit a Triple crime,
I’d like to have him on my side. Richard, \m/.

My colleagues Aftab Iqbal and Jindřich Mynarz whom I have worked with to
publish CSO Ireland and Eurostat Linked Dataspaces. Thank you for your support.

Much appreciation goes to Jeni Tennison and Edward Curry for their invaluable
feedback to help me bring this work to its final state.

And my friend Joanne Downs, a true philosopher at heart, that kept me on my
toes with her enthusiasm to run after knowledge and sometimes 9780812696110.

Yet another thanks goes to my family for their continuous support in my
academic and professional adventures, even though I can’t adequately explain to
them what I really do on the InterWebs. Without their encouragement, I would
not have been a curious fellow.

I am grateful for my partner’s love, and insights, which held me together
all this time. Brigitte Schuster, /7.

When in doubt, mu.

-Sarven

¸ø•*`*•ø¸ø•*`*•ø¸ø•*`*•ø¸ø•*`*•ø¸¸ø•*`*•ø¸¸ø•*`*•ø¸ø•*`*•ø¸ø•*`*•ø¸ø•*`*•ø¸¸ø•*`
Table of Contents
Table of Figures
- Linked Dataspaces Architectural Workflow
- Linked Dataspaces architectural workflow from case studies and contributions
- GraphPusher sequence
- Determining named graph flowchart
- Linked Data Request and Response interface
- Linked Data Pages architecture
- Galway City page on DataGovIE
- CSO Ireland deployment architecture
- Eurostat deployment architecture
- World Bank deployment architecture
Table of Tables
- Dataspaces to Linked Dataspaces
- Linked Dataspace components, and implementations
- Comparison of manual and GraphPusher approaches
- Interlinks in CSO Ireland
- Interlinks in Eurostat
- Interlinks in World Bank
- CSO Ireland Linked Data
- Eurostat Linked Data
- World Bank Linked Data
- Provenance in CSO Ireland, Eurostat and World Bank Linked Datasets
Introduction
This thesis investigates the design and implementation of statistical Linked Dataspaces. This chapter provides an overview of this document and its purpose: what are some of the problems and our assumptions, what are we trying to improve, and how are we going at it.
Problem statement
Convenient management of dataspaces for statistical Linked Data remains to be costly and lacks integrated and automated tool support. The design considerations and requirements are therefore at the forefront for reasonable functionality of these dataspace platforms.
Access to statistical data, primarily in the public sector has increased in recent years. While these initiatives provide new opportunities to get insights on societies, management of the dataspaces are consequently confronted with new challenges. As centralized dataspaces are now faced with more heterogeneous data collections, with varying quality, solutions which employ the Linked Data principles appear to be promising.
However, due to a range of technical challenges, development teams often face low-level repetitive data management tasks with partial tooling at their disposal. These challenges on the surface include: addressing data integration, synchronisation, and access. Within the context of statistical data, the expectations from these dataspaces is that, a Linked Data tool-chain is used, and the data is accessible to both humans as well as the machines.
Hypothesis
It is contended that the deployment of statistical Linked Data comes with a specific set of requirements. The degree in which the requirements are accomplished predetermines the dataspace’s usefulness for data consumers. Therefore, the hypothesis of this document is if a specific set of requirements for building and managing dataspaces for statistical Linked Data is possible, and if the development of missing parts will make the dataspace more useful.
Contributions
With preference to minimizing developer intervention wherever possible, the contributions herein are within the expectations of working in Linked Dataspace and providing read access to data respectively. The set of design considerations and requirements are derived from case studies in publishing 2006 Irish Census, Eurostat, and World Bank datasets. The contributions are as follows:
- Statistical Linked Dataspaces
- Deriving requirements for statistical Linked Dataspaces and proposing an architecture.
- Required components
- Identification of required components to create a dataspace.
- GraphPusher
- A tool to automate the process of building a dataspace through dataspace descriptions.
- Linked Data Pages
- A publishing framework that allows custom query results and HTML templates for resources.
- Best practices
- Summary of the lessons learned from development pitfalls, workarounds, and best practices on data retrieval, modeling, integration to publishing.
Document Outline
Chapter 2 presents background material for this document. It covers the essentials of the dataspace concept and summarizes its core components. The Linked Data design principles as well as Linked Statistics are explained in order to draw a bridge from dataspaces. Existing Linked Lifecycle models are also summarized in order to provide the basis of the problem space. Chapter 3 contains an overview of the Statistical Linked Dataspaces, the core proposal of this document. It makes a connection between the general dataspaces concept with Linked Dataspaces, and proposes that Linked Dataspaces is well suited for deploying statistical data by outlining its requirements. Chapter 4 then outlines the required components with actual implementations of the technologies where GraphPusher and Linked Data Pages are put forward as contributions. Chapter 5 ties it all together by examining the phases and components of the case studies to realize Statistical Linked Dataspaces. Chapter 6 concludes by analysing the work described, results achieved, lessons learned, and the feature work up ahead.
Background
This chapter gathers and summarizes some of the fundamental knowledge that is necessary in order to discuss the design of Linked Dataspaces for statistical data.
Dataspaces
The services that are typically offered in today’s information management systems have to deal with integration and administration of diverse data sources. An abstraction layer for the applications in these systems are considered as Dataspaces
as proposed in From Databases to Dataspaces (Franklin, M., 2005). The services that are built over dataspaces are known as DataSpace Support Platforms
(Halevy A., 2006).
- Participants and Relationships
- The participating data sources in a dataspace can be databases, repositories, web services or software packages. The source data can be structured, semi-structured or unstructured, where some may be set to allow updates, yet others only for reading. Similarly, a dataspace may have different relationship models between its sources, with descriptions at any level of granularity, as well as information on data provenance.
- Catalog and Browse
- Dataspaces may include services to allow different modes of interaction with the data sources. Systems might simply provide services to support access to its catalogue in order to allow users to browse its inventory of data resources. Catalogues may have metadata about the resources such as their original source, used schemas, statistics on the data, creators, various timestamps, licensing, completeness and so forth. This type of provenance data provides a perspective for the users and administrators about the elements in the data sources, as well as assistance in reproduction and quality analysis.
- Search and Query
- One other type of service is meant for discovering data by way of searching and querying. The primary function for these services is to allow users to locate and extract particular information from the data sources. A search service offers relevant results to users based on keyword searches, as well as further exploration of the results. Its purpose is to provide a mechanism to deal with large collections of unfamiliar data using natural languages that users are familiar with. A query service in contrast, is meant to provide a structured way to retrieve or manipulate information in participating data sources. One important differentiating factor between searching and querying is that, a query service can let users formulate far more complex questions about the data and get answers to them.
- Local storage and index
- In order to give the data sources a home and to allow inquiry services, a storage and an accompanying index component is used. Local storages and indexes aid in creating efficient queries, precise access to data, and support for data recovery and availability. Indexes are invaluable in terms of identifying information across data sources.
- Discovery and extensions
- Another type of dataspace service is the discovery component which is used for relating dataspace participants and consequently allow the system to provide better query results. This component would discover, identify and classify data sources and their content in order to easily locate and refer to items in the dataspace in the future. It is important for this component to monitor and allow an environment to update the schema mappings over time in order to accurately represent the dataspace’s assets.
- Pay-as-you-go
- In creating semantic relationships between data sources, the involvement of users is usually focused on taking care of most beneficial efforts first. The system is expected to allow incremental improvements based on the knowledge of the underlying data’s structure, semantics and relationships between sources. Hence, a pay-as-you-go approach to data integration is employed in dataspaces as complete upfront integration is considered to be difficult and is not a required goal (Madhavan, J., 2007).
Linked Data
One manifestation of the Semantic Web vision is Linked Data. It is a pragmatic approach to publishing structured data on the Web in order to discover related data from different sources. The Linked Data design principles [1] were put forward by Tim Berners-Lee in 2006 as follows:
- Use URIs as names for things.
- Use HTTP URIs so that people can look up those names.
- When someone looks up a URI, provide useful information, using the standards (RDF*, SPARQL).
- Include links to other URIs. so that they can discover more things.
- HTTP URIs
- In a nutshell, the use of URIs allows us to refer to things and concepts, whether they are real or imaginary, in an absolute way. In order to persistently make use of things, Tim Berners-Lee proposed that
any resource of significance should be given a URI
. By employing the widely adoptedhttp:URI scheme, the idea for Linked Data sets off in terms of providing a representation for requested resources. - RDF data model
- The key ingredient in the information that is returned to the user has to do with the model of the data in the response. Regardless of the syntax that is used, Resource Description Framework (RDF) is essentially an entity-relationship model that provides a way to make statements about the things in our reality. A statement contains three atomic parts, also known as a triple: the subject resource which the statement is about, followed with a property which is a vocabulary term that describes the type of relationship it has to an object resource. Each of these components are typically represented using HTTP URIs, with the possibility of the object resource being a literal string. In mathematical terms, RDF is a directed, labeled graph, which conceptually depicts a graph of things. What makes this method to make claims about things worthwhile is the act of linking any two resources identified through URIs together in a particular way. It fundamentally presents an opportunity to discover new resources in an uniform way, whether the resource is in local storage or somewhere else. [2]
- RDF vocabularies
- In RDF triple statements, properties are vocabulary terms that are used to relate a subject to an object. As these resources are accessible via HTTP URIs, when dereferenced they provide a description for the term in use. Some of the well-known vocabularies that are used in Linked Data publishing include: Friend of a Friend (FOAF) [3]; to describe people and the things that they do, RDF Data Cube vocabulary [4]; which is used to describe multi-dimensional statistical data, British reference periods, Simple Knowledge Organization System (SKOS) [5]; to describe controlled thesauri, classification schemes and taxonomies, DCMI Metadata Terms (DC Terms) [6]; for general purpose metadata relations, and Vocabulary of Interlinked Datasets (VoID) [7]; to provide metadata on datasets.
- SPARQL
- SPARQL Protocol and RDF Query Language (SPARQL) is a protocol and a query language to retrieve and manipulate RDF data. It can be used to express queries across local and remote data sources, whether the data resides in RDF files or databases. SPARQL queries consist of graph patterns written in a fashion similar to Turtle (an RDF format), and allows modifiers for the patterns. In the Linked Data community, it is common to see publicly accessible SPARQL endpoints where queries are sent and received over HTTP. Federated queries can be written to compute results that span over different SPARQL endpoints on the Web.
The Linked Data efforts are concerned with publishing and querying all sorts of data that is interconnected in the form of Tim Berners-Lee’s Giant Global Graph. Some of the motivations behind this is to uncover insights about societies, build smarter systems, making predictions, democratizing data for people, or to make better decisions.
Linked Statistics
As pointed out in Official statistics and the Practice of Data Fidelity (Cyganiak, R., 2011), domain-specific formats such as PC-Axis [8] or Statistical Data and Metadata eXchange (SDMX) [9], an ISO standard for exchanging and sharing statistical data and metadata among organizations, re-using statistical data has become more feasible. However, with the complexity introduced by these formats, the barrier for consuming the data has raised as well. On the other hand, general-purpose formats such as Microsoft’s Excel or CSV are very widely deployed and a number of tools and libraries in any kind of programming language one could possibly think of exist to process them. The down-side of these formats is equally obvious: as much of the high-quality annotations and metadata, that is, how to interpret the observations, is not or only partially captured, the data fidelity suffers. Even worse, using these formats, the data and metadata typically gets separated. With linked statistics, one can leverage the existing infrastructure as well as retaining metadata along with the data, yielding high data fidelity, consumable in a standardised, straight-forward way. However, the handling of statistical data as Linked Data requires particular attention in order to maintain its integrity and fidelity.
Going beyond the operations of slicing, filtering and visualising statistical data typically requires out-of-band information to combine it with other kinds of data. Contextual information is usually not found in the statistical data itself. Using linked statistics, we are able to perform this data integration task in a more straight-forward way by leveraging the contextual information provided by the typed links between the data items of one dataset to other datasets in the LOD cloud.
The RDF Data Cube vocabulary is used to express multi-dimensional statistical data on the Web, and its data model is compatible with the cube model that underlies SDMX. The design of the Data Cube vocabulary picked up on the lessons from SCOVO, a lightweight RDF vocabulary for expressing statistical data, Semantic Statistics: Bringing Together SDMX and SCOVO (Cyganiak, R., 2010), SCOVO: Using Statistics on the Web of Data (Hausenblas, M. 2009). Data cubes are in the nature of a hyper-cube such that multiple dimensions may be used to refer to a particular observation in the cube. Data cubes are characterised by their dimensions, which indicate what the observation is about with a set of properties; its measures to represent the phenomenon that is being observed with a value; and optionally with attributes which help interpret the measure values with a unit. Dimensions typically represent concepts, which are taken from a code list, and are highly valuable as they may used across data cubes by any consumer. Code lists, also known as classifications, are typically identified by using the SKOS vocabulary in RDF.
What linked statistics provide, and in fact enable, are queries across datasets: given the dimensions are linked, one can learn from a certain observation’s dimension value, other provided dimension values, enabling the automation of cross-dataset queries, hence cutting down integration costs and delivering results quicker.
Organisations that are involved in publishing statistical Linked Data and establishing related methodologies and best practices include the UK Government [10], the National Institute of Statistics and Economic Studies [11], the U.S. Bureau of Labour Statistics [12], and the European Environment Agency [13]. Statistics from many other sources are currently published not by the original statistics producer, but by third parties (universities, web technology companies etc.): U.S. Census 2000, Spanish Census [14], including historical microdata, EU election results, International Monetary Fund [15] commodity prices to name a few as well as the data from Central Statistics Office Ireland, Eurostat, and World Bank, which we will focus on in this paper.
Linked Data Lifecycles
In recent years, a number of Linked Data deployment phase models have emerged. From Government Linked Data wiki, known Lifecycles [16] are as follows:
- Hausenblas, M., in Towards a Web-scale Data Management Model - Linked Data Life Cycles [17].
- (Hyland, B., 2011), in The Joy of Data - A Cookbook for Publishing Linked Government Data on The Web.
- (Villazon-Terrazas, B., 2011), in Methodological Guidelines for Publishing Government Linked Data.
- DataLift [18].
- (Auer, S., 2011), in LOD2 Stack in Introduction to Linked Data and Its Lifecycle on the Web.
All models at their core describe the cycles taking place from data extraction, transformation, to publishing Linked Data. One common understanding between these lifecycles is that, although phases are linear, the full cycle is repeated and can be re-picked up from any phase. In other words, there is an expectation from the dataspace such that it allows jumping between the phases and be incrementally improved. This particularly holds true for phases which include interlinking of resources with resources in other dataspaces. It is also in-line with the pay-as-you-go approach as described earlier in Dataspaces.
The lifecycles that Hausenblas et al. and the LOD2 stack proposes a view that is derived from publishing various types of Linked Data, whereas Hyland et al., Villazon-Terrazas et al, and the DataLift vision base their cases from the deployment of government Linked Data.
Challenges
As statistical data is inherently highly structured and comes with metadata (in form of code lists, dictionaries, etc.), particular challenges are posed in order to deal with the large-scale data behind the scenes, as well as offering interaction services for querying and visualising. While these challenges are present in various levels in different dataspace implementations, here we observe the specific challenges in context of Linked Dataspaces. For instance, RDF data modeling, and RDF store optimisation techniques are some of the precursors for the level of data discovery and user interactivity that is achieved.
In order to provide a useful Linked Dataspace, this typically means that the data should be well-maintained; for instance, synchronized or kept up to date with most recent changes, catalogued in a way that data sources can be browsed or discovered by any user, making sure that data provenance is given attention, and relationships to other data sources are drawn.
These and similar challenges and approaches, among many, are also discussed in Modelling of Statistical Linked Data (Mynarz, J.), Querying Heterogeneous Datasets on the Linked Data Web (Freitas, A., 2012), Linked Data and Live Querying for Enabling Support Platforms for Web Dataspaces (Umbrich, J., 2012), and Provenance in Linked Data Integration (Omitola, T., 2010).
Related Work
Data spaces which adheres to Linked Data principles are previously discussed in Linked Data Spaces & Data Portability (Idehen, K., 2008), and Linked Data: Evolving the Web into a Global Data Space (Heath, T., 2011), also acknowledging the close relationship between Dataspaces
and the current efforts in Web of Data
. That is, these informations systems typically try to integrate heterogeneous data and provide mappings in a pay-as-you-go manner.
With respect to statistical Linked data, a variety of deployment approaches are undertaken. Through the increased availability of publicly open and accessible statistical data from governments to various independent organisations, best practices to publish Linked Data have started to emerge.
An experiment with publishing statistical data that was alike to the described use-cases in both scope and extent is described in Publishing Statistical Data on the Web (Salas, P., 2012). The work conducted in this case took statistical data from dados.gov.br, a Brazilian data portal, as its input; focusing on CSV files and data from OLAP. The tools developed for conversion of source data to RDF were implemented as OntoWiki [19] extensions. CubeViz [20] was used to visualize the multidimensional statistical data. The data was interlinked with DBpedia and Geonames using the LIMES [21] software. Among the problems encountered the authors list a need for data pre-processing into a desired share, encoding non-ASCII characters to UTF-8, and difficulties in dealing with ambiguities stemming from multiple resources sharing the same string labels.
One of the first statistical datasets expressed with the Data Cube vocabulary that was not published by a research institution is the EU Digital Agenda Scoreboard [22]. In this case, statistical data serves as an input for evidence-based policy monitoring the implementation of the goals of Digital Agenda for Europe strategy. More than 100 thousand triples from the data on the performance indicators monitored for the Digital Agenda for Europe in EU member countries is published with OntoWiki [23] both in HTML, CSV, RDF, and JSON. The data is enriched with 33 thousand links to the RDF version of Eurostat data presented in this paper. The authors of the converted data report being limited in the possibilities for interlinking. Either the relevant datasets are not available in RDF or are not among the datasets approved for linking by Eurostat, The Digital Agenda Scoreboard: an statistical anatomy of Europe’s way into the information age (Martin, M., 2012).
In Modelling of Statistical Linked Data (Mynarz, J., 2011), also have reported on the modelling aspects of statistical Linked Data and provided an comprehensive comparison of 20 statistical RDF datasets regarding coverage, data access, vocabularies and other relevant aspects. Further, Official Statistics and the Practice of Data Fidelity (Cyganiak, R., 2012), provide an overview to the field of official statistics, discuss the modelling of statistical data in RDF including its integration with other kinds of government data, tools for data conversion and publishing of statistics as Linked Data, and methods for using statistical data in queries, reports, and visualisations.
In Linking UK government data, (John, S., Tennison, J., 2010), discusses what it takes to create a linked government data; publishing open government data, benefits of adopting Linked Data technologies, contributions, and lessons learned.
In Getting to the Five-Star: From Raw Data to Linked Government Data (Maali F., 2011), and A Publishing Pipeline for Linked Government Data (Maali F., 2012), discusses a self-service
approach to publishing government data as Linked Data. One of tool contributions is an RDF extension [24] to Google Refine [25] which allows transformation of tabular formats e.g., CSV to different RDF formats.
In his thesis, Linked Open Data for Public Sector Information (Mynarz, J., 2012), first explores the competitive advantage of linked data for release of public sector information
and the challenges associated with the adoption of linked open data for public sector information
.
LinkedCT: A Linked Data Space for Clinical Trials, (Hassanzadeh, O., 2009), explains the data space that was created to publish clinical trials as Linked Data. With particular attention to transforming trial data to RDF, interlinking with other data sources, string and ontology-based semantic matching for link discovery.
Linked Data and dataspaces is motivated in System of Systems Information Interoperability using a Linked Dataspace, in particular to enterprise energy management (Curry, E., 2012).
Managing the life-cycle of Linked Data with the LOD2 Stack (Auer, S., 2012), discusses in detail the tools that are created and integrated in several dataspaces in LOD2 [26] projects.
Statistical Linked Dataspaces
With the background material introduced, this chapter will dive into Linked Dataspaces and explain how it is a suitable platform to deploy statistical data. It will first present a possible connection between Dataspaces and Linked Dataspaces, give an architecture for a Linked Dataspace, and derive some requirements from case studies to build a dataspace which is particular to deploying statistical Linked Data.
The idea of Dataspaces as discussed earlier was proposed without being tied to any particular set of technologies or types of data. It is a broad description for what constitutes a dataspace. For the moment, without diving into specific technologies, tooling, or data, possible parallels can be drawn between Dataspaces and dataspaces which follows the Linked Data design principles. Table [1] presents a generalized view for the components and services in Linked Dataspaces.
| Dataspaces | Linked Dataspaces |
|---|---|
| Catalog | RDF dataset descriptions |
| Browse | HTML, RDF publishing framework |
| Local store and index | RDF files, stores, HTTP URIs |
| Search and Query | Free-text search and SPARQL |
| Discovery and relationships | Link discovery framework |
| Data management extensions | Semi-automatic data deployment |
| Metadata and provenance | RDF metadata vocabularies |
As Dataspaces are not attached to any specific list of data deployment services or practices, the Linked Dataspace can be seen as a narrower or a particular realization of a Dataspace. Having a dataspace that adheres to Linked Data principles is that, one of the forefront goals is to offer the data sources and some of its services in a way that the underlying data can be globally accessed and linked to by external data sources and applications.
The proposal here is that, with the assumption of publishing statistical data in a way that its components can be identified, discovered, and disseminated for numerous uses, a Linked Dataspace can be an ideal candidate. A statistical Linked Dataspace needs to identify resources and provide access to their descriptions, where such resources are in the nature of code lists, data cube observations, datasets and structures. Some of the specific challenges include: extraction of original data sources, transformations to RDF, and loading (ETL) to data storage services; creating global identifiers for the resources in its data catalogs; using vocabularies which are designed for modeling statistical data; offering services to the outside world such that its participating data sources can be browsed through; discovery via text searches and structured queries; and building interlinks with other data sources. Figure [1] depicts a architectural pipeline of Linked Dataspaces. While this diagram depicts a workflow from one phase to another in a particular direction, the phases themselves are not necessarily tied to one another. For example, given the pay-as-you-go approach, certain interlinks may be created and published straight away without having to go through any other component.
Figure 1: Linked Dataspaces architectural workflow

Requirements
A set of requirements to create a statistical Linked Dataspace are derived from the case studies of deploying CSO Ireland, Eurostat, and World Bank Linked Data. The requirements are based on analysis of the original data sources, such as their characteristics in terms of quality, quantity, and update frequency.
A high-level inspection of published statistical data reveals itself as a collection of significant amounts of data, compiled over time by different parties. Naturally the quality of the data sources vary from one publisher to the next, as they try to cater for different publishing criteria. For instance, statistical data is often available in different data formats (e.g., CSV, XML, JSON, SDMX-ML, PC-Axis), with varying vocabularies and thesaurus that is specific to publisher’s view about the data. In terms of consumption, one particular example is as follows: the usefulness of raw data that is available in CSV format may depend on the availability and quality of the metadata for the terms that are used in the file. The shape in which the data is available, sets the tone for the data consumer. That is, the characteristics of the original data sets some boundaries on how well it can be reused by the others. This is typically because the consumer wants to do something with the data but to what extend they can accomplish that is really dependent on the input quality.
Therefore, it is reasonable to conclude that a number of decisions need to be made in order to prepare the dataspace for retrieval and reuse. A questionnaire along the following lines can help determine core requirements by analysing each case study:
- Overview
- Who is the data publisher?
- Which parties were involved in compiling the original data?
- What data is being published?
- What is the importance of that data?
- Who are the people to contact?
- Is the accuracy of the data indicated?
- Are there different versions or variations of the data?
- Retrieval
- Which formats is the data available in?
- How big is the data?
- How frequently is the data updated, if at all?
- How many retrieval requests need to be made?
- Which access points is the data distributed through?
- Are there special access privileges required to retrieve the data?
- Processing
- Is the necessary tooling in place in order to work with the available formats?
- Are the data files syntactically well-formed?
- What are some of the candidates for things that can be interlinked?
- Publication
- What is the data license and terms of use?
- Is there sufficient metadata?
- Which languages is the data and metadata available in?
- What granularity is the data in?
Data sources
The following initial observations are made about the data sources:
CSO Ireland
The Central Statistics Office (CSO) [27] is the official Irish agency responsible for collecting and disseminating statistics about Ireland. The main source of the statistical data for the CSO is the National Census that is scheduled to be held every five years. The data compiled by the CSO serve as a key input for decision-making in the Irish government and it informs its policies and programmes both at national and local levels.
The CSO publishes population statistics in several ways, none of which is particularly suited for direct reuse. The data is primarily available through the CSO’s website, formatted for the purpose of display. The CSO offers access to raw demographic data in PC-Axis format for expressing multidimensional statistical data. CSO exposes raw data in an interactive data viewer provided by the Beyond 20/20 software [28] that allows to browse, sort and plot the data. It offers a way to export the data to XLS and CSV.
Eurostat
Eurostat [29] is the statistical office of the European Union with the aim to provide European Union statistical information in a way that can be comparable at European level. Statistical data collection is done by statistical authorities of each member state. They verify and analyse the data before sending it to Eurostat. Eurostat’s role is to consolidate the statistical data they receive from each member state and ensure that they are comparable. Eurostat actually only provides harmonized statistical data using common statistical language.
Eurostat offers access to datasets using the bulk download facility [30]. The datasets are published by Eurostat in three different formats: Tab-seperated values (TSV), DFT and SDMX. This makes it possible for users to import the data into the tool of their choice. A complete list of datasets which are published by Eurostat is made available through table of contents. Although there is no filtration on the different types of statistics provided by Eurostat, the datasets essentially cover statistical information along the following themes: general and regional statistics, economy and finance, population and social conditions, industry, trade and services, agriculture and fisheries, external trade, transport, environment and energy, and science and technology.
World Bank
The World Bank [31] is an international development organization that provides access to a comprehensive set of data about countries around the globe. The publicly available statistical data is collected from officially-recognized international sources, and consists of a wide array of observations on development indicators, financial statements, climate change, projects and operations.
The World Bank provides a free and open access to numerous datasets in their data catalog [32]. These datasets are available in one or more formats: XML, JSON, CSV, XLS; with additional geospatial data in Shapefile SHP and Keyhole Markup Language KML, and supporting documentations in PDF. The World Bank APIs offer some of the datasets primarily in XML and JSON representations, whereas the rest of the formats are available as data dumps. In our use-case, the decision on which datasets to work with was based on several factors such as the importance of the dataset, its completeness, and the ease of converting it into an RDF representation. Hence, the following datasets from the World Bank’s API was selected with the preference of working with XML:
- World Bank Climate Change (WBCC) [33] contains data from historical observations and future projections derived from global circulation models.
- World Development Indicators (WDI) [34] contain various global development data on world view, people, the environment, the economy, states and markets, and global links. It includes national, regional and global estimates.
- World Bank Finances (WBF) [35] cover Banks’ investments, assets it manages on behalf of global funds, and the Banks’ own financial statements.
- World Bank Projects and Operations (WBPO) [36] provides information about the lending projects from 1947 to present along with links to publicly disclosed online documents.
Core requirements
The following core requirements are distilled from the analysis above as the deployment of CSO Ireland, Eurostat, and World Bank Linked Dataspaces as described in chapter 5. A statistical Linked Dataspace:
- Storage space and RDF store
- Must have storage space where the retrieved raw data will be stored and processed in the file system, as well as an RDF storage and server to host the transformed RDF data.
- Transformation tools
- Must have a set of tools to preprocess and convert non-RDF structured data to RDF. This primarily includes tools that would allow inspections, modifications, and conversion of the data into other RDF formats.
- Enrichment tools
- Must have a set of tools that can help to improve on the existing data. In order to fulfil the 4th Linked Data design principle some of the important resources in the data needs to be interlinked with resources elsewhere. Therefore, the dataspace should either have tools to semi-automate the discovery of potential resources, or provide ways to manually find such resources. Another way to enrich existing data would be by way of aggregating related or useful data that is not in the original data.
- Vocabularies
- Must have an RDF vocabulary to describe the statistical data model and Should have a set of vocabularies that can describe the relationships in the data, code lists, and metadata for the datasets.
- Data Synchronisation
- Should keep up to date with the changes that are made to the original data. This is important as far as making sure that the data is accurate and relevant.
- Publication
- Must publish the data consumable in any one of the standardized RDF formats, and allow SPARQL queries to be run over the data given the 3rd Linked Data design principle. May provide RDF data dumps in order to allow data consumers to easily retrieve the full dataset. Should provide an HTML interface to browse through the data or its catalog for human consumption.
Components
This chapter will identify a concrete list of required components to realize a statistical Linked Dataspace and give an in-depth explanation of the contributed technologies to fill-in some of the gaps in Linked Dataspaces.
Given the requirements to publish a statistical Linked Dataspace as discussed earlier, Table [2] outlines a list of required components to realize such space with example implementations. If we take a look at the Linked Dataspace architecture in Figure [1] again, we can see how some of these components and services are grouped together.
| Components | Implementations |
|---|---|
| Environment | Linux, Apache |
| Data retrieval | CURL, Java, LDSpider [37], Marbles [38], wget |
| Data preprocessing | Manual with custom scripts, Google Refine |
| Data modeling | RDF extension for Google Refine, Neologism [39] |
| Data conversion | XSLT, CSV2RDF, D2RQ [40] |
| RDF store and SPARQL servers | TDB [41], Fuseki [42], Virtuoso [43], Sesame [44], 4store [45] |
| Loading RDF data into RDF store | Manual with custom scripts |
| RDF store optimization | TDBstats [46] |
| Interlinking | Manual inspection and selection, Silk [47], LIMES |
| Enrichment | DL-Learner [48], Stanbol [49] |
| Database metadata | VoID, LODStats [50] |
| Data dumps | File system |
| User interface | Callimachus [51], Linked Data API [52], OpenLink Data Explorer [53], Pubby [54] |
For some of the components, there are several implementations that are publicly available for use. A range of improvements can be done for each implementation with varying complexity. In the case studies, two areas in particular were identified for possible areas for improvements given the state of the art of publicly available technologies: loading of RDF data to RDF store, and presenting an interface for humans.
It turned out that loading RDF data was a recurring task that had to be performed by the administrator. Hence, the GraphPusher tool (described in detail in section 4.1) was built to improve on the manual approach by automating bulk data. GraphPusher was primarily used to help to deploy the Irish Government Linked Dataspace at DataGovIE [55] and this is a report on preliminary findings on using this tool. As discussed in data sources for CSO Ireland, the data primarily consists of statistical data about the Irish population.
On a similar note, Linked Data Pages (described in detail in section 4.2) was written to provide better control over front-end templating system to present a Web interface for RDF data. The Linked Data Pages framework was used to publish CSO Ireland and World Bank [56] Linked Dataspaces.
Both of these contributions are discussed in further detail in the following sections.
Figure [2] reflects the contributions of this thesis within the Linked Dataspace architectural workflow.
Figure 2: Linked Dataspaces architectural workflow from case studies and contributions

GraphPusher
The manual creation of dataspaces conforms to Linked Data principles is time consuming, and prone to human errors since there are a number of steps involved to gather the data, and place them in a store. Typically a list is compiled consisting of datasets with graph names for each dataset, and local copies of the data that is to be imported in to a store. This information may be tracked in a structured format, or a simple text file. The VoID is used because it is an accepted standard to describe RDF datasets, as well as the SPARQL 1.1 Service Description (SD) [57] for discovering information about a SPARQL service.
One of the goals of publishing a VoID file alongside datasets that are published as Linked Data is to allow consumers to discover and retrieve the data. Based on this, the GraphPusher tool [58] is designed to aid users to retrieve and import data in RDF format into a graph store by making use of the metadata in a VoID file. VoID describes access methods for the actual RDF triples in a number of different ways. GraphPusher focuses on two of these methods; dereferencing HTTP URIs and compressed RDF data dumps.
Given RDF data that is to be imported into a graph store, additional information is required in order to carry out the update process; how to access the store, dataset to store in, and graph name to use. It naturally follows that this unique information needs to be handed over to the store per dataset for the update. When dataspaces are updated frequently, it brings forward a reason to perform with a script, minimizing human involvement and errors. Therefore, the underlying purpose for GraphPusher is to help with data deployment as efficiently as possible.
Where users are publishers and consumers at the same time, the creation of a VoID description can be seen as a declarative programming approach to putting RDF data into data stores. GraphPusher’s potential use is to help applications to pull in Linked Data.
GraphPusher was originally created to fulfil the data deployment need of DataGovIE’s production and staging datasets. DataGovIE reuses its published VoID description to feed its own dataspace with incremental changes to data.
GraphPusher approaches this task with the following sequence. Figure [3] gives an illustration.
- Compiling a list of datasets to be retrieved to local space and graph name to use per dataset or file. This is accomplished by retrieving a VoID file and extracting the
void:dataDumpproperty values. It also looks for SD’ssd:nameproperty in VoID, where they are collected to name the graphs in the RDF store. In the case thatsd:nameis not present, the graph name method is determined by user’s configuration in GraphPusher. - Datasets are downloaded to local disk. For compressed dataset archives, they are decompressed.
- Finally, the data is imported into the graph store by either executing an update operation on the RDF store directly, or through the SPARQL service via SPARQL Update.
Figure 3: GraphPusher sequence

Implementation
A reoccurring dataspace operation in Linked Data environments is the retrieval of remote data and placing them in an RDF storage. In the case of rebuilding an RDF store, the approach is to use a VoID description for the datasets in order to batch process some of the recurring steps. This is typically accomplished by publishing a VoID description of the datasets with triples using the void:dataDump property, and optionally with sd:graph and sd:name properties.
Related work
To the best of publicly available practices, there exists no technology that builds a dataspace automatically. The work is based on VoID as SADDLE [59] and DARQ [60] do not provide the required metadata coverage for dataset access, and VoID has 30% coverage in the Linking Open Data (LOD) [61] and is actively maintained.
About the code
GraphPusher takes a VoID URL as input from the command-line, retrieves the VoID file, looks for the void:dataDump property values, HTTP GETs them, and finally imports them into an RDF store using one of the graph name methods. The graph name method is defined as part of GraphPusher’s configuration.
In order to specify the location of the RDF store for the data that is to be imported, GraphPusher can take either TDB Triple Store’s assembler file which contains configuration for graphs and datasets, or a SPARQL service URI. If the TDB assembler filename is provided in the command-line argument with --assembler, GraphPusher checks this file to determine the name of the dataset and its location. It will then import the data dumps using the TDB loader. Alternatively, with the --dataset option, GraphPusher uses Apache Jena’s SPARQL over HTTP command-line script [62] to HTTP POST by using the SPARQL 1.1 Graph Store HTTP Protocol [63].
GraphPusher is written in Ruby, and relies on the rapper [64] RDF parser utility, and optionally the TDB Triple Store. GraphPusher is configurable, e.g., location to store the data dumps, method to determine named graphs. It decompresses archived data dumps to a local directory, converts files with unrecognised RDF format extensions to Turtle format before importing. It is tested and functional in Debian/Ubuntu systems, available under the Apache License 2.0 [65].
Determining graph name
Where possible, GraphPusher makes a decision for dataset’s named graphs by staying consistent with publishers’ intentions. In certain cases, it tries to indicate the origin of the data by reusing the dataset location in the graph name.
Figure [4] illustrates the flow for this process.
If sd:name is present in VoID, its value has highest priority because it explicitly states the named graph that is used in the dataset, and consequently how it can be referenced in a FROM/FROM NAMED clause.
If sd:name is not present, GraphPusher looks for one of the graphNameMethod configuration property values: dataset, dataDump, filename. By default dataset value tells the GraphPusher to simply use the URI of the void:Dataset. If dataDump is set, the named graph IRI becomes the IRI of the data dump. Alternatively, if the filename method is used, the file name is appended to the graphNameBase URI value.
Figure 4: Determining named graph flowchart

Preliminary Results
As there exists no automated approach to have local copies of the data dumps, determining a graph name per data dump, and importing the data into a store, the manual approach is used as baseline to compare against. The following criteria are used for comparison:
Configurability: The manual approach allows the user to configure the loading process as they see fit, whereas the GraphPusher approach comes with a predetermined list of configuration options to import the data. In that sense, GraphPusher is naturally limited to its feature set.
Requirements: The bare-bone manual approach would typically make use of wget or curl to download the dataset files, several archive tools to decompress compressed datasets, and an RDF parser to convert a given dataset file in an RDF format to N-Triples format, where it is suitable for pattern matching with the grep tool.
Efficiency: The steps mentioned above would require the user to posses knowledge of command-line operations and running SPARQL queries, and depending on their expertise and available tools, given test runs, it takes 20 minutes or more if executed by hand. The automated approach in GraphPusher would typically take a minute or two to configure and run from command-line. The efficiency of each approach is noteworthy, especially when this task is repeated for different datasets and metadata.
It should be noted here that, the expertise and time needed to have the required tools set up in the system is excluded as they vary from one favourable approach to another in a given operating environment. VoID is GraphPusher’s primary requirement, hence the assumption is that a VoID file exists, or can be generated.
Table [3] gives an overview for the comparison of manual and GraphPusher approaches.
| Manual | GraphPusher | |
|---|---|---|
| Configurable | Full | Predefined |
| Requirements | None | VoID |
| Efficiency | See earlier discussion | |
Conclusions
GraphPusher illustrates a direct application of reusing a VoID description to pull in datasets to a dataspace. At its core, it takes advantage of RDF’s follow your nose discovery to support data ingestion pipelines. This is in line with the Linked Data methodology as it mostly relies on dereferenceable HTTP URIs.
Given the following limitations of GraphPusher, there is future work in plans:
- Retrieval of a VoID description in an RDF store via a SPARQL Endpoint.
- Ability to skip data dump retrievals by checking for datasets’ timestamps in HTTP headers (e.g., ETag, Last-Modified), and using local copies where appropriate.
- Techniques to optimize storage footprint for duplicate copies of retrieved datasets.
- Merging all dump files per graph into a single N-Triples file before importing to the RDF store for more efficient loading. Consequently, this approach needs to account for blank nodes which occur in different files with the same identifier.
- Support other popular RDF stores e.g., Virtuoso RDF Quad Store [66] and 4store, to directly communicate with the store – currently TDB Triple Store is supported.
Linked Data Pages
It is important to highlight some of the core components of a Linked Data user-interface framework. The 3rd Linked Data design principle suggests to provide the data in RDF, a machine readable format, in the HTTP response. The obvious thing we can infer from this is that the mechanism that is required to publish RDF data needs to be able to take in resource requests, look for them in its dataspace, and compile an appropriate response back. This process can work in conjunction with responses to human users as well as machines. That is, with the help of HTTP Accept headers, content-negotiation can be done on the requesting agent’s preferences. With this approach, a given URI can be requested in one of the RDF formats, HTML, or JSON. This provides an opportunity for different types of users to make use of the underlying data.
Linked Data front-end architecture
Figure [5] illustrates a general process from the requested URI (input) to a response in HTML or RDF (output). The steps which take place are as follows:
- Request: An agent requests a URI from the server.
- Consolidation: The URI is looked in the dataspace, and the resource it identifies is prepared by transforming it into a particular representation.
- Presentation: Either an HTML page is created based on a template, or an RDF output is generated for the same data.
- Response: Depending on the preferred request format, either HTML or RDF is returned to the user.
Figure 5: Linked Data Request and Response interface

As an attempt to use a publishing architecture as such, existing frameworks were investigated in 2010. To name a few, Fresnel [67], LESS [68], Pubby, and Paget [69] was explored for use in DataGovIE website. The idea was to use a tool that 1) had the necessary features for data consolidation, and 2) allowed custom templating for resources. The fundamental shortcomings of these tools appeared to be that on the templating side, they offered de facto generic entity rendering of RDF resources in HTML i.e., a tabular view of properties and objects of a subject resource. This was also typically the result of a DESCRIBE SPARQL query [70] for a given resource such which simply returned a response identified by an URI.
Linked Data Pages architecture
In order to make the HTML user interface more user friendly, Linked Data Pages (LDP) [71] was developed. The motivation was to not only make the publishing process possible as other attempts, but also to make it easier for publishers to customize the HTML output. Instead of starting from scratch, Paget was extended since it had a good feature base which matched DataGovIE’s needs. Figure [6] illustrates LDP’s architecture:
Figure 6: Linked Data Pages architecture

LDP is built on top of Paget, which requires Moriarty [72], and ARC2 [73] libraries. Paget is a versatile Web application written in PHP. Its HTML rendering of RDF is basic in a sense that information is displayed in a tabular way. LDP extends on Paget’s framework in order to output human readable Web pages. Additionally, LDP relies on its URI dispatch mechanism and to build a local index of the RDF data gathered from SPARQL query results.
The main benefit of LDP is that URI patterns can be grouped with unique SPARQL queries and custom HTML templates.
Setup
LDP can be configured from the installation web page, or directly from the configuration file. The configuration is fairly basic and primarily consists of the following:
- Directories
- Directory paths where each of the libraries (LDP, Paget, Moriarty and ARC2) reside in the file system.
- SPARQL service URI
- The URI in which the SPARQL queries are sent to.
The service can be configured with the following parameters:
- Site settings
- Site name and domain name, root URI for access, theme to use, and site logo.
- URI host mapping
- If the host name that the service is running under is different from the host name that is used in the URIs in the RDF data, this setting allows mapping between the the two. For example, if there is a request is made to
http://example.org/foo, the setting can be set to look forhttp://example.net/fooin the RDF store instead.
LDP is bundled with a default CSS theme and allows different stylesheets to be used.
The reason to develop the URI host mapping feature was based on the fact that in the early stages of modeling 2006 Census data, the URI patterns were designed based on the knowledge of having the data work under govdata.ie. During the staging phase of publishing the RDF data under data-gov.ie, the URI patterns were not changed and hence had to be mapped as an interm solution until the URI patterns in the data model was updated.
Resource sets
In order to provide a simple and flexible way for site owners to prepare responses for their data, resource patterns can be configured to customize outputs. LDP has a way to organize what the URIs should describe and how they should be presented for the user in HTML and RDF. When a resource is requested, it is matched with most intended representation by configuring the three essential components together. The first is the URI pattern in question that is being made available, the second is the SPARQL query that it triggers when requested, and third is the template that is to be used to render the HTML page. Definitions of each of the components are defined as such:
- URI pattern
- Patterns are triggered in a way that when a URI is recognized, the most precise URI is selected for the response. This is in contrast to more relaxed patterns which are used to display. For instance, for code lists, each concept URI can be rendered the same way, such that it was best to use the root path (code list) as opposed their full path. e.g., when
http://worldbank.270a.info/classification/country/CAis requested, there would be a URI pattern looking out forhttp://worldbank.270a.info/classification/country/to respond with an output for all countries the same way. Of course, if one wishes to renderhttp://worldbank.270a.info/classification/country/CAdifferently than the other countries, it can be done by using that URI pattern in the configuration. - SPARQL Queries
- Once the URI pattern is determined, a SPARQL query needs to be triggered to retrieve a description of the resource. A full blown SPARQL query pattern can be entered here for each resource. If there is no URI pattern matched, it will default to
DESCRIBE <URI>. - HTML templates
- When an URI pattern and a SPARQL query to trigger is matched, an HTML template is also assigned at the same time. The templating system has access to the response gathered from the SPARQL query. An index of values can either be accessed directly, or a set of helper methods can be used directly from the template. For example, a low level function like
getTriplescan be used to find triples in an index (a multi-dimensional array). When no parameters are provided, it returns the full index. However, it can be used to look for particular set of triples by passing in full URIs or QNames. For more complex templating or data processing, theSITE_Templateclass offers additional methods. - If there is no URI pattern matched, the default template will be used to output the results in a key-value pair fashion by invoking a
DESCRIBESPARQL query.
In order to better control the contents of the output for different contexts, the framework should offer ways to do some sort of data manipulations. This is more about aggregating additional data, whether from different SPARQL endpoints, cached results, or compiled on the go; and filtering data in different ways to make it more suitable for the consumer. Through Paget, LDP offers a number of methods to accomplish these where some are extended in site specific implementations.
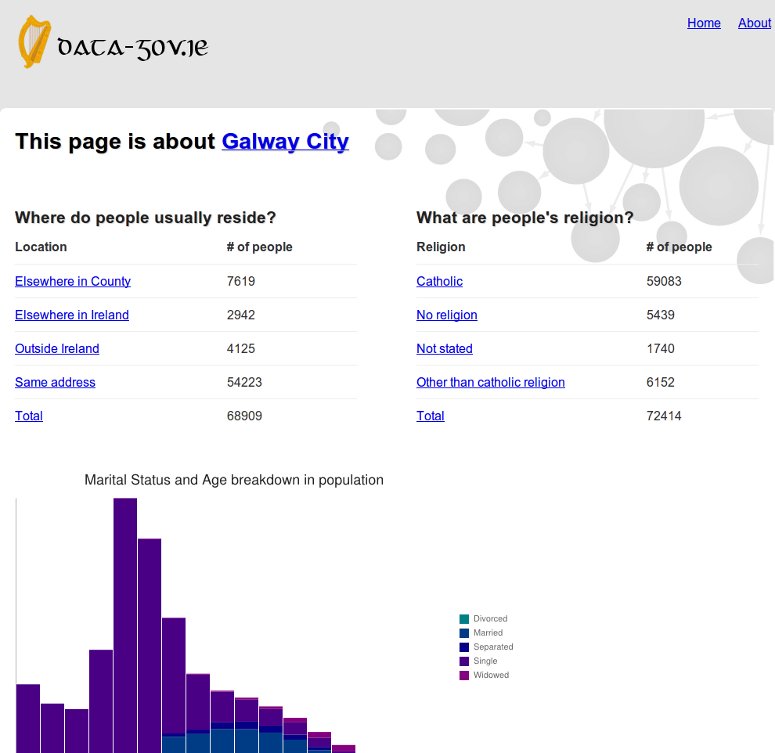
Figure [7] shows a screenshot of the Galway City page at DataGoVIE.
Figure 7. Galway City page on DataGovIE
From the implementation side, Linked Data Pages provides results based on the URI pattern that is triggered. In other words, what information a resource contains and how it is represented is determined at the URI level. An alternative approach to outputting would be based on the characteristics of the resource. That is, the triple graph pattern from a SPARQL query result can be taken and then based on desired parameters, the results can be passed to a template.
The How to create a Linked Data site [74] document explains the full process in further detail; from setting up a SPARQL service, importing data, to publishing documents using LDP.
Conclusions
Linked Data Pages works well by letting the publishers (developers) focus mostly on what the resources should contain and how they should be presented on a web page. Although some understanding of the way the tool is required, with some intervention, custom HTML pages for different types of resources can be created fairly easily. Given that statistical Linked Data needs to distinguish different code lists, and Data Cubes, Linked Data Pages approach looks promising.
Case Studies
Here we discuss the realization of three statistical Linked Dataspaces.
In the past couple of years we have witnessed an increasing number of efforts to publish statistical data on the Web following the Linked Data principles. This chapter reports on our experiences and lessons learned in the process of publishing statistical data along three case studies: Irish Census, Eurostat, and World Bank. Comparison of different deployments are made in terms of methodology, URI patterns and vocabularies, metadata, and data access and discuss the underlying design decisions in each case.
The World Bank dataspace was realized entirety by the myself. The CSO Ireland and Eurostat datasets was modeled by other members of DERI, whereas I’ve helped in data deployment and publishing.
Deployment Architecture
Figures [8], [9], [10] illustrate an overview on the overall architecture of the deployment of our three case studies. They will be discuss in further detail in the following sections.
Figure 8. CSO Ireland deployment architecture

Figure 9. Eurostat deployment architecture

Figure 10. World Bank deployment architecture

Data Retrieval
This section discusses the methods used to retrieve the statistical data from original sources.
CSO Ireland
Data from the 2006 Irish Census was retrieved manually, downloading each slice of small area population statistics individually via the export to Excel files from the CSO’s instance of the Beyond 20/20 [75]. 14 datasets in CSV format in total of 8MB were manually retrieved using the interactive application by clicking on the access URLs.
Eurostat
There are approximately 6100 datasets published by Eurostat. Eurostat updates information about datasets as well as table of contents twice a day. The datasets holds statistics on daily, monthly, quarterly and annual basis. Therefore, certain datasets are updated daily and many datasets are updated on monthly basis. To keep Eurostat RDF datasets up to date, we scheduled a cronjob, which runs a set of scripts on weekly basis. In order to avoid unnecessary RDF transformations of each dataset, we only update the changed datasets within the past week.
Along with the datasets, Eurostat also publishes Data Structure Definitions (DSD) about each dataset, as well as a set of dictionaries (code lists) which are shared among all datasets. Hence we take into consideration every type of information provided by Eurostat. The DSDs are published in XML format while the code lists are published in TSV format. Given that the datasets, metadata and code lists each provide different type of information and is represented differently, we wrote Java programs to process XML and TSV formats of the metadata, dataset and code lists separately.
We have written different shell scripts which wrap each Java program and one main script which handles the whole process of data downloading and transformation by invoking other scripts.
Over 13000 HTTP GET requests were made to Eurostat to download raw datasets, DSDs and code lists, with a total of disk space of ~58GB.
World Bank
The World Bank datasets were collected by making requests to the World Bank API endpoints using the XML output format.
World Bank APIs was called ~150000 times to retrieve all of the WDI, WBF, WBCC, WBPO datasets, with a total disk space of ~20GB.
The data is retrieved at irregular periods - at least once a month - from the World Bank API endpoints. The retrieval act is partly based on new dataset announcements in World Bank mailing lists. Although the data retrieval and transformation phases are conducted by independent scripts, the commitment to retrieve and store the data is based on achieving the quality of the eventual RDF serialization. Therefore, Java and Bash scripts are manually executed to retrieve, in order to closely monitor abnormalities in the responses and account for necessary changes in the transformations.
Data Preprocessing
In this section, we cover some of the observed abnormalities in the original datasets, and the decisions which were made in order to later achieve reasonable RDF serializations. The information in this section is not exhaustive, and is only meant to illustrate some of the recurring challenges.
CSO Ireland
The data was paged to several files that had to be pieced together, saved as CSV files, and provided with a different character encoding. Statistical data in the retrieved datasets were attributed to one of two mutually overlapping conceptualizations of Irish geography. There were datasets coded with enumeration areas and datasets coded with electoral districts. Both types of datasets were downloaded and combined during the conversion to RDF.
Eurostat
Although we parse TSV files to generate observation values using the RDF Data Cube vocabulary, the TSV files exclude the observation (frequency) values. In order to add the frequency value to each dataset, we parsed the SDMX files to retrieve the frequency value of each dataset.
Observations with values : (means not available) were left out during the RDF transformations.
dcterms:date property was used for reference periods in Eurostat. We have encountered various reference periods and converted them into appropriate date literals while doing RDF transformation:
YYYY-MM-DD date format was used where we encountered reference periods like: {YYYY}M{MM}D{DD}, {YYYY}Q{QQ}, {YYYY}M{MM}, {YYYY}S{SS}, {YYYY}.
YYYY-MM-DD date format was used where we encountered reference periods like: {YYYY}_{YYYY}. We do not have time format information available in the data set which makes it hard to tell if the observation values are for 1 or x number of years.
Certain observation values represent reference period values as Long Term Annual Average (LTAA). We did not know how to deal with LTAA in RDF and Eurostat does not provide any information about it in the metadata of that particular dataset. Hence, we wrote a small Turtle file which contains the definition of LTAA. Reference periods mentioning LTAA in original dataset for any particular observation value were represented in RDF using the URI provided by the Turtle file.
World Bank
In order to arrive at a proper and useful Linked Data representation, some of the following problems were solved either with a script or manually updated, and others were brought up to the World Bank team’s attention for investigation.
For preprocessing, we have identified several recurring issues in the original data, and decided on workable solutions. They are: units of measurements in the observations were part of the indicator string were left as is; missing observation values in the API response were excluded in the transformation phase resulting in ~80% reduction in number of observations with actual measured data; various naming patterns (primarily regions) in WBF differed from WDI such that alternative names had to be added to WBF in order to arrive at canonical representations during the XSLT process; missing country codes which were identified in the WDI observations but not in the country code list was added.
Data Modeling
In this section we go over several areas which are at the heart of representing statistical data as Linked Data. Which vocabularies are reused and created, URI design patterns, and Data Cube’s data structure definitions are discussed for each of the case studies.
Vocabularies
All three data models use common vocabularies: RDFS, XSD, OWL, XSD, FOAF, and RDF Data Cube is used to describe multi-dimensional statistical data, SDMX for the statistical information model, British reference periods (Year [76], Gregorian Interval [77]), SKOS to describe the concepts in the observations, and DC Terms for general purpose metadata relations.
The first versions of the converted data in CSO Ireland relied on elements from SDMX/RDF but these elements were subsequently replaced with more generic elements from the Data Cube Vocabulary (e.g., qb:Observation instead of sdmx:Observation) or SKOS (e.g., skos:ConceptScheme in place of sdmx:code list).
In the World Bank case of country codes, ISO 3166-2 [78] is used as the primary representation for countries. For example, the URI http://worldbank.270a.info/classification/country/CA identifies the country Canada in the datasets.
URI Patterns
A number of URI design patterns are established in recent years with similar considerations and guidance for developing and maintaining URIs e.g., the report Designing URI Sets for the UK Public Sector (Chief Technology Officer Council, 2009), and Linked Data Patterns Identifier Patterns [79].
All three datasets make use of slash URIs throughout the schema and data, with the exception that Eurostat uses hash URIs for its observations. The reason for this was to keep the URI patterns consistent and to make sure that all important resources when dereferenced returned information. Since the content size of the responses for statistical data may be heavy, the slash URIs approach appeared to be preferable to hash URIs, as the latter would not allow distinct requests in majority of the deployments on the Web. This is independent of accessing these resources via SPARQL endpoints.
CSO Ireland
All the resources in the 2006 Irish Census dataset use slash URIs. The geographical code lists for enumeration areas and electoral districts employ hierarchical URIs [79], in which identifiers of geographical areas are nested within the "namespace" URIs of their parent geographical features (e.g., an enumeration area nested under a county), Modelling of Statistical Linked Data (Mynarz, J., 2011).
In 2006 Irish Census dataset, blank nodes were used only for identification of instances of qb:ComponentSpecification. All other resources were identified with URIs.
Eurostat
The base URI for Eurostat is http://eurostat.linked-statistics.org/. We kept the same file name for the metadata and the actual dataset containing observation values as they appear in the original data and distinguish them by using dsd and data in URI patterns. Further, the code lists which are shared among all datasets are provided by using dic in the pattern. The following URI patterns are used:
Metadata: (DSDs) have the pattern http://eurostat.linked-statistics.org/dsd/{id}, where id is one of the dataset’s metadata file.
Datasets: are within http://eurostat.linked-statistics.org/data/{id}, where id is the filename for the dataset containing observation values.
Code lists: use the pattern http://eurostat.linked-statistics.org/dic/{id}, where id is the dictionary filename.
Observations: use the pattern http://eurostat.linked-statistics.org/data/{dataset}#{dimension1},{dimensionN}, where the order of dimension values in the URI space depends on the order of dimension values present in the data set.
World Bank
New URIs for classifications and properties were created because the majority of the properties and concepts did not already exist in the wild, and in cases where they did, they did not fully correspond with the World Bank’s. For instance, the country codes in the World Bank data are not only composed of concepts of countries, but also other geopolitical areas and income levels.
Terms in the URIs are in lower-case and delimited with the minus-sign. The dimension values are used as the terms in the URI space and are delimited with a slash.
The general URI space consists of:
Classifications are composed of code lists for various concepts that are used in the World Bank datasets. The concepts are compiled by using the accompanied metadata from the World Bank, and are typed with skos:Concept. Each code list is of type skos:codeList and have a URI pattern of http://worldbank.270a.info/classification/{id}, where id is one of: country, income-level, indicator, lending-type, region, source, topic, project, currency, loan-type, loan-status, variable, global-circulation-model, scenario, basin. Each concept is defined under the code list namespace hierarchy e.g., http://worldbank.270a.info/classification/country/CA is the concept for country Canada.
Properties have the URI pattern http://worldbank.270a.info/property/{id}.
Data Cube datasets use the URI patterns: http://worldbank.270a.info/dataset/{id}, where id is one of; world-development-indicators, world-bank-finances, world-bank-climates.
Named graphs in RDF store are placed in http://worldbank.270a.info/graph/{id}, where id is one of; meta, world-development-indicators, world-bank-finances, world-bank-climates, world-bank-projects-and-operations.
World Development Indicators observations are within http://worldbank.270a.info/dataset/world-development-indicators/{indicator}/{country code}/{YYYY}.
World Bank Finances observations are within http://worldbank.270a.info/dataset/world-bank-finances/{financial dataset code}/{row id}.
World Bank Climate Change observations are within http://worldbank.270a.info/dataset/world-bank-climates/{id}/{various patterns separated by slash}.
Blank nodes: By in large, the datasets do not contain blank nodes, with the exception of unavoidable ones in the Projects and Operations code list. In order to offer a metadata file for World Bank’s schema, some of the files with blank nodes had to be merged. In order to avoid the conflict on collapsing bnodes with the same identifier, the decision to carry this out was based on a method that happened to be most efficient; import all of the metadata files into a named graph in RDF store, then export the named graph to a single file.
Data Structure Definitions
CSO Ireland
In most cases, the data structure of the 2006 Irish Census data in RDF follows the structure of the source data, even though the transposition of the modelling patterns from the original data to its RDF version was not optimal from the perspective of modelling data in the Data Cube vocabulary. For example, for every source file representing an individual view on the Census data an instance of qb:DataStructureDefinition was created with dimensions that preserved the structure of the original file. Following this guideline data aggregation into a multidimensional data cube was deferred to a later stages of data processing.
Nevertheless, the guideline of preserving the original data structure was not adhered to in all of the cases. There were labels used inconsistently in the source data. For example, both "Geographical Area" and "Geographic Area" were used in the data. In such cases, where multiple labels referred to the same concept, they were merged.
The same treatment was applied on the extracted code lists that were reconstructed in RDF in a way copying their original structure. For example, multiple separate code lists for age were recreated in RDF and mapped together. A number of code lists featured "Total" as a coded value. This practice was also retained in RDF versions of these code lists.
Eurostat
Eurostat publishes data structure definition of each dataset separately. Eurostat data structure definition consists of concepts, code lists and components. The component wraps all of the concepts and their associated code lists defined in a particular data structure definition. We defined all concepts as skos:Concept in our modeling approach. Further, all the code lists were defined as skos:ConceptScheme.
Eurostat publishes their own code lists as well as reuse SDMX code lists. For example, Eurostat uses their own custom code list to represent different indicators but reuse Frequency code lists from SDMX content-oriented guidelines [80].
World Bank
Each dataset from the World Bank was treated on a case by case basis for DSDs as they had different data models:
- World Development Indicators are available as a single observation model where it contains indicators, reference areas, and time series as dimension values, and the corresponding measurement value.
- World Bank Finances come in several sub-datasets with different structures i.e., the observations in the datasets contain different set of dimensions, along with a number of measurements and attributes.
- World Bank Climate Change contains sub-datasets for different historical and future observations. They primarily include data on: reference area, reference periods, statistical types (averages and anomalies), measured variables and derived statistics, global circulation models.
World Bank Projects and Operations are treated as a code list of projects.
Data Conversion
CSO Ireland
The conversion of 2006 Irish Census data was conducted with a custom Python script based on librdf [81]. Due to a relatively small volume of the data the conversion was initially implemented using an in-memory RDF store. Nevertheless, we have discovered it to be insufficient for every but the smallest datasets. Consequently, to cater for the larger datasets, the implementation switched to a file back-end based on BerkeleyDB [82].
Still, the back-end was not capable of handling the computation of aggregated values using SPARQL queries. To compute aggregates a more performant, standalone triple store would be needed. Ultimately, we have decided to keep the back-end and postpone generation of aggregate values to a later stage when the data would be loaded into a triple store.
Another implementation trade-off that we had to make was related to the SPARQL engine in librdf. Due to the engine not being able to execute certain types of SPARQL queries, queries were de-optimized in order for the engine to process them. For example, direct use of URIs in SPARQL graph patterns was not handled properly so that the URIs were matched in the FILTER clause.
The most time consuming task of the conversion regarded "reverse engineering" of code lists used in the data. Most code lists were reconstructed manually from the headers and column names in the original data. However, unlike the majority of code lists containing several items, geographical code lists were too large to be processed manually and thus it was necessary to automate their extraction. Geographical code lists, such as the enumeration areas, had to be distilled from the statistical data referring to them. Since the statistical data contained little information about the code lists (e.g., code-name pairs), it was difficult to establish identity in them (e.g., resolve name clashes).
Eurostat
Various tools have been used in the publishing process: our custom-written Java program was first used to download and transform the Eurostat datasets, metadata and the code lists into RDF. Eurostat publishes more than 6100 datasets which when converted into RDF took more than 533GB of disk space yielding ~8 billion triples altogether. Instead of hosting such a huge number of triples via an SPARQL endpoint, we generated a catalog file which contains a set of triples specifying the location of a particular dataset on the file system.
The updated datasets are reflected through lastUpdate date field associated to each dataset in the table of contents file. We have scheduled a cron job which runs every weekend and execute the following steps:
- Download the new table of contents file and compare it against last week table of contents file.
- Compare the
lastUpdatefield from the two table of contents file for each dataset; - For all those datasets, whose
lastUpdatefield has changed, add them to the conversion list; - For each dataset in the conversion list, invoke the necessary scripts to download dataset and their associated meta data and transform them into RDF.
- Replace existing RDF datasets as well as metadata with the new updated RDF datasets and metadata;
- Update SPARQL endpoint;
- Replace the old table of contents file with the new table of contents file for comparison in the next week cron job.
The approximate time of updating Eurostat RDF datasets on weekly basis is 3-4 days depending on the number of datasets updated or added in a week time. We have also setup a mailing list which provides information on our weekly updates to the interested Eurostat users. After the update has been completed, an email is automatically sent to the mailing list describing the number of datasets which have been modified, added, and deleted.
Some of the code list names in Eurostat reuse the names in SDMX-XML codes, hence they were kept as is since the RDF Data Cube vocabulary already uses SDMX-RDF. For other cases, they were renamed to closest possible vocabularies in RDF.
World Bank
XSLT 2.0 stylesheets were created to transform the source XML files to target RDF/XML serializations. Saxon’s command-line XSLT and XQuery Processor [83] tool was used for the transformations, and employed as part of Bash scripts to iterate through all the files in the datasets. The conversion step from the command-line with saxonb-xslt under the Ubuntu operating system was preferred over Java’s SAXTransformerFactory Class as it was significantly faster in preliminary tests.
In order to import this data into the RDF store rather efficiently, rapper RDF parser utility program was used to first re-serialize each RDF/XML file as N-Triples and appended to a single file at run-time before importing.
Linked Datasets
These sections explain the work done on data interlinking and enrichment, and the resulting RDF datasets.
Data Interlinking
Interlinking things and concepts from our RDF datasets to external datasets in the LOD Cloud was a challenging task. It primarily requires an investigation to identify eligible resource types in our datasets, and then finding suitable matching resources in external datasets. One requirement was to make sure that the target resources were dereferenceable in order to make the interlinking worthwhile. Tables [4], [5], [6] give an overview of the targeted external datasets, entity types, links, and counts for each of the three cases respectively.
CSO Ireland
Interlinking for CSO Ireland was done by manually investigating useful URIs.
| Target dataset | Entity type | Link type | Link count |
|---|---|---|---|
| DBpedia | dbo:Country | owl:sameAs | 52 |
| DBpedia | skos:ConceptScheme | skos:closeMatch | 9 |
| DBpedia | skos:Concept | skos:exactMatch | 5 |
| Geonames | skos:Concept | skos:exactMatch | 4 |
Eurostat
The Silk Framework was used to publish initial link sets.
| Target dataset | Entity type | Link type | Link count |
|---|---|---|---|
| DBpedia | dbo:Country | owl:sameAs | 1899 |
| LinkedGeoData | lgdo:Country | owl:sameAs | 1876 |
World Bank
The dataset is interlinked using LInk discovery framework for MEtric Spaces (LIMES). While a great portion of the codes were matched automatically, it included a review step to catch false positives, true and false negatives, as well as curating the final results, A Time-Efficient Hybrid Approach to Link Discovery (Ngonga Ngomo, A.-C., 2011). Some of the code list concepts were manually matched with corresponding links in DBpedia using skos:exactMatches and skos:closeMatches, as well as to the World Bank site using foaf:pages.
| Target dataset | Entity type | Link type | Link count |
|---|---|---|---|
| DBpedia | dbo:Country | owl:sameAs | 216 |
| DBpedia | sdmx:Currency | owl:sameAs | 164 |
| DBpedia | skos:Concept | skos:exactMatch | 5 |
| DBpedia | skos:Concept | skos:closeMatch | 3 |
| Eurostat | dbo:Country | owl:sameAs | 216 |
| Geonames | dbo:Country | owl:sameAs | 216 |
| World Bank | foaf:Document | foaf:page | 119526 |
Data Enrichment
In this section we talk about some of the ways that we tried to enrich the original data by adding information such that the datasets can be more useful, better discovered, interlinked or queried.
CSO Ireland
The only data enrichment for CSO Ireland was the addition of World Geodetic System WGS triples using rdf:type of wgs:Point, as well as latitude and longitude using wgs:lat and wgs:long to the descriptions of Irish city resources.
Eurostat
Each of the observation values were typed with rdf:datatype. The reason is some datasets have combination of numeric and decimal values which makes it harder to query or the user has to cast the datatype for observation values with different data types before making query. To avoid data type casting at query level, we pre processed all observation values of a dataset and associated the appropriate data type to all observation values in a particular dataset before serializing it into RDF.
World Bank
A code list for currencies was created based on ISO 4217 currency and funds name [84] to represent the SDMX attributes for the amount measurements in the World Bank Finances datasets. They were also linked to each country which officially uses that currency. Given that some of the codes in the World Bank country code list are not considered to be countries e.g., 1W representing World, only the resources which represented a real country have an added rdf:type instance of dbo:Country.
RDF Datasets
Tables [7], [8], [9] outlines the current state of RDF Linked Datasets for CSO Ireland, Eurostat, and World Bank. The size of the dataset are in rounded number of triples. The datasets’ VoID files would normally contain exact numbers.
| Dataset | Format | Size | Number of triples | Number of observations |
|---|---|---|---|---|
| 2006 Irish Census | Turtle | 776MB | 12M | 1.6M |
| Dataset | Format | Size | Number of triples | Number of observations |
|---|---|---|---|---|
| Datasets | RDF/XML | 533GB | 8B | 1B |
| DSDs | Turtle | 347MB | 6M | N/A |
| Code lists | RDF/XML | 21MB | 0.3M | N/A |
| Dataset | Format | Size | Number of triples | Number of observations |
|---|---|---|---|---|
| Climate Change | RDF/XML | 10GB | 78M | 7M |
| Development Indicators | RDF/XML | 8.4GB | 79M | 11M |
| Finances | RDF/XML | 827MB | 7M | 0.25M |
| Projects and Operations | RDF/XML | 93MB | 0.96M | N/A |
Loading RDF data into RDF store
The data was loaded into the TDB RDF store using TDB’s incremental tdbloader utility. In some instances, SPARQL Update was used.
CSO Ireland
As the data model for CSO Ireland was improved over time, the RDF store had to be loaded several times. In the earlier versions of Fuseki and its TDB RDF store, the RDF store also had to be rebuilt in order to optimize query responses accordingly. GraphPusher was used to help automate bulk-loading via TDB. As the size of the 2006 Irish Census RDF data dumps are under 15MB compressed in total, downloading of the dumps to a temporary location multiple times raised no issues.
Eurostat
The sheer large size of Eurostat’s RDF data dumps (~533GB RDF/XML) presented a challenge to load them into an RDF store given that the resulting store size would have been multiple factors greater than the original dumps. Even if the load time, as well as space used was put to the side, querying over such a large dataset would have been difficult to optimize for reasonable response times.
World Bank
Given the current scope of GraphPusher for not being able to work with local files, it was not suitable for it to download the World Bank’s RDF data dumps repeatedly, since its compressed size was around 400MB. However, simple bash scripts were written to load the data directly to TDB store. The process to load the files was done in two steps:
- Each RDF file which belonged to the same named graph was transformed to N-Triples format using the rapper utility, and then concatenated to a single N-Triples file. The cost of this extra transformation reduced the load time into the TDB store.
- Loading of each N-Triples files to corresponding graphs.
Files which were known to contain blank nodes were not merged as they posed a conflict, and hence loaded individually.
Store optimization
TDB’s tdbloader is an incremental loader that updates its index after each data load. On the initial load, a statistics file is created based on the contents of the data. The statistics file contains metadata about statistics (time and date the file was generated, size of graph), and the frequence count of predicates. Although the numbers are estimated, they are not required to be exact for the TDB Optimizer. More specifically, the counts lets the optimizer choose one execution plan over another when queries are made.
Since the statistics file is generated only once after the first data load, it is subject to going stale when more data is added to the store. This meant that the statistics file had to be updated using TDB’s tdbstats utility.
Data License
All our published Linked Data adheres to original data publisher’s data license and terms of use. Additionally attributions are given on the websites.
CSO Ireland
The use of the 2006 Irish Census data is governed by the re-use of Public Sector Information Statutory Instrument 279/2005 [85], which allows reuse provided that the creator (i.e., CSO) is attributed, the information is represented in an accurate way, and the information is used for a non-commercial purpose.
Eurostat
The actual Eurostat datasets adhere to Eurostat’s terms of use [86] while the RDF data is licensed under CC0 1.0 Universal (CC0 1.0) Public Domain Dedication [87].
World Bank
In addition to adhering to World Bank’s terms of use [88], the RDF data that is published is licensed under CC0 1.0 Universal (CC0 1.0) Public Domain Dedication.
Publication
In this section we talk about various ways of making our Linked Datasets publicly accessible, discoverable, and usable.
Data Provenance
Table 10 outlines the vocabulary terms that are used in particular for provenance information in all three case studies. The provenance metadata for 2006 Irish Census was not created during the process of conversion to RDF. Some of the properties were added to the VoID file at a later stage.
| Type of provenance | CSO Ireland | Eurostat | World Bank |
|---|---|---|---|
| Defining source | rdfs:isDefinedBy | ||
| License | rdfs:seeAlso | dcterms:license | |
| Source location | dcterms:source | dcterms:source | dcterms:source |
| Related resource | dcterms:hasPart, dcterms:isPartOf | ||
| Creator of the data | schema:creator | foaf:maker | schema:creator |
| Publisher of the data | dcterms:publisher | ||
| Creation date | dcterms:created | dcterms:created | dcterms:created |
| Issued date | dcterms:issued | ||
| Modified date | dcterms:modified | dcterms:modified |
VoID
We described the Linked Datasets with the VoID vocabulary. It is generally intended to give an overview of the dataset metadata i.e., what it contains, ways to access it or query it.
CSO Ireland
A VoID file was compiled for the CSO Ireland datasets [89], including locations of RDF datadumps, named graphs that are used in the SPARQL endpoint, used vocabularies, size of the datasets, and interlinks to external datasets.
Eurostat
The VoID file is planned for the next Eurostat Linked Data release.
World Bank
A VoID file was compiled for the World Bank Linked Datasets [90], including locations to RDF datadumps, named graphs that are used in the SPARQL endpoint, used vocabularies, size of the datasets, and interlinks to external datasets. Dataset statistics are generated and also included in the VoID file using LODStats, LODStats – An Extensible Framework for High-performance Dataset Analytics (Demter, J., 2012).
User-interface
Here we briefly discuss how the published data can be access primarily using a Web browser.
CSO Ireland
The website is located at http://data-gov.ie/. The HTML pages are generated and published by the Linked Data Pages tool. Linked Data Pages is used to invoke unique SPARQL queries based on the requested URI. The results are outputted in corresponding HTML templates. Links to alternate RDF formats as well as in JSON are handled by content-negotiation. Given the nature of the invoked SPARQL query, alternate formats may contain additional triples like labels for the vocabulary terms not contained in the RDF dumps. This minor difference is mentioned for the users on the site. For some resources e.g., cities, Google Charts Tools [91] is used to display various visualizations in place of the tabular data in the HTML.
Eurostat
The website is located at http://eurostat.linked-statistics.org/ [92] where it contains custom static HTML pages, with links to dump directories, and SPARQL endpoint.
World Bank
The website is located at http://worldbank.270a.info/. The publication of approach of the World Bank Linked Data is same as CSO Ireland.
SPARQL Endpoint
The SPARQL endpoints are accessible publicly with no authorization requirements. As a trade-off, the SPARQL service is subject to high resource demands from the server for certain query types. No query restrictions were placed in any of the cases.
CSO Ireland
The endpoint allows access to the full schema and datasets, and uses named graphs. With the same setup as World Bank (see below) with its own SPARQL endpoint [93].
Eurostat
This endpoint includes only the schema and excludes the data (~533GB RDF/XML) due to the limitation of the available computing resources and performance reasons. With the same setup as World Bank (see below) with its own SPARQL endpoint [94].
World Bank
Apache Jena’s TDB storage system and Fuseki is used to run the SPARQL server. Data in RDF format was incrementally loaded from into TDB RDF store using Jena’s tdbloader script from command-line. A public SPARQL endpoint [95] is available which accepts SPARQL 1.1 queries. The endpoint allows access to the full schema and datasets, and uses named graphs.
Data Dumps
The data dumps come in different formats, primarily either available in native RDF formats, or they are compressed for easy retrieval. Dumps are usually made visible by a link on the sites, or mentioned in the VoID files. They are also announced in the Data Hub.
CSO Ireland
The CSO Ireland’s RDF data dumps [96] are available in RDF Turtle compressed with gzip.
Eurostat
The Eurostat’s RDF data dumps [97] are available as individual RDF/XML files from the file system.
World Bank
The World Bank’s RDF data dumps [98] are available either as individual RDF/XML files or in compressed gzip format.
Source Code
All program codes used to create are publicly available. It allows other developers to investigate or improve on approaches taken here in their own space.
CSO Ireland
The code which transforms the source data to RDF serializations can be found at GitHub: data-gov-ie/cso2rdf [99].
Eurostat
The code which transforms the source data to RDF serializations can be found at GitHub: LATC/EU-data-cloud [100].
World Bank
The code which retrieves the World Bank data, transforms it to RDF serializations, and imports to TDB Triple Store can be found at GitHub: csarven/worldbank-linkeddata [101]. It is using the Apache License 2.0.
Announcing the Datasets
Announcing a datasets consists of letting the world know about the Linked datasets that follows the Linked Data principles. Typically it involves submission to data catalogs (e.g., see below for the Data Hub), writing a blog post, mentioning it on mailing lists and so on. This allows the datasets to be discovered in a number of different ways.
CSO Ireland
The dataset is registered in the Data Hub with ID: data-gov-ie [102]. The dataset has level 4 in the CKAN Validator. It is in the lodcloud group.
Eurostat
The dataset is registered in the Data Hub with ID: eurostat-linked-data [103]. The dataset has level 1 in the CKAN Validator. It is in the lodcloud group. And it is also available in the LATC project’s EU data cloud.
World Bank
The dataset is registered in the Data Hub with ID: world-bank-linked-data [104]. The dataset has level 4 in the CKAN Validator. It is in the lodcloud group.
Conclusions
This thesis identified some of the required components and deployment phases needed to realize statistical Linked Dataspaces. The motivations behind this was to make the publishing of statistical Linked Data easier. The investigation for it was to see whether a specific set of technologies helped with such challenges by looking at the lessons learned from the case studies.
Lessons learnt
It can be stated that the lifecycle that is in place to deploy a statistical Linked Dataspace is very close to existing Linked Data lifecycle models. The main emphasis that should be made here is the extra attention given to modeling statistical data, interlinking, and accompanying provenance data. Publishing code lists for reuse, and dataset metadata for discovery is at the core of making statistical Linked Data useful internally and externally. Therefore, it is contented that tools that can bring extra value to these processes would be particularly useful in this dataspace.
The remaining question, which requires our attention is whether a Linked Dataspace for statistical data has particular characteristics than any other data that is deployed under the same dataspace. Statistical data is inherently highly structured and comes with rich metadata. In contrast to other types of data such as text or multimedia heavy content:
- There is typically no Natural Language Processing (NLP) component necessary.
- Due to its structured nature and consequently a high number of observations, the resulting RDF tends to be high volume which makes it more challenging to provide queries over the data via a SPARQL endpoint.
- One has to deal with a multitude of dimensions and measures which can be particularly challenging in terms of visualization and interaction with the data.
In terms of tool contributions, GraphPusher and Linked Data Pages although are helpful in statistical Linked Dataspaces, they can work just as well for other types of data. As a VoID file adds immensely to the discovery of datasets, then publishing one for statistical Linked Data only helps to be better found and used across multiple disciplines. Similarly, code lists are extremely useful for reuse across data sources if only they can be discovered. From this, it could be said that GraphPusher sufficiently tackles on the problem of consuming various statistical Linked Data by simply making use of published VoID files. When GraphPusher gets the feature to decide whether to work with local or remote files, the process of bulk-loading can be put to better use. As seen in our case studies, GraphPusher was useful for CSO Ireland, but not for World Bank data dumps at this time. With that aside, GraphPusher is handy when dealing with large datasets. In Linked Data Pages’ case, publishing statistical data may be particularly useful if unique templates are created to illustrate dataset structures and code lists for better human consumption.
Future work
As raw statistical data is available in different ways: from access points, formats, quality, to quantity, it consequently impacts Linked Dataspaces’ organization and operation. In other words, while the dataspaces for each case study operated in a similar fashion on the surface, materializing Linked Data from raw data, and its access differed. For instance, given the sheer size of observations in Eurostat, it made more sense to offer the observation data as flat RDF files as opposed to making the data accessible via a SPARQL endpoint. One reason was due to the fact that RDF stores index the data in variety ways which requires multitude amounts of disk space alone. Querying over the data in a reasonable fashion was predicted to not be the case due to available system resources; disk space and memory. This raises some challenges: whether statistical Linked Dataspaces which contain large volume of data can be queried on small to medium-level systems, and areas to improve in RDF stores e.g., indexing methods, store optimizations.
It turned out that, numerous number of tools and methods are employed to create a dataspace which in the end still required human intervention at different phases in the Linked Data lifecycle. While some of this is unavoidable, further focus on automation is beneficial. In practical terms, this is due to the fact that meanwhile each component operated well within its area, there was no global workspace which glued all of the components together for ubiquitous operation. Hence, the integration of tools in dataspaces is a much needed requirement for future Linked Dataspaces to minimize human errors and better resource management.
Another lesson is that the current publishing frameworks and interfaces are still inadequate for simple user interactions. For instance, the shortcomings of flexible interface components for statistical data makes it difficult to get a good understanding of multi-dimensional nature of observations. Hence, future work could focus on improving the interaction, interpretation, and visualization of statistical Linked Data by means of enabling existing tools (either specialized or general purpose applications) which consume RDF. With this, domain experts can benefit from the Linked Data in their native environment. Further, standardization of code lists and vocabularies e.g., RDF Data Cube, and SKOS is vital for cross-domain interpretation.
Given the sensitive nature of statistical data – as it describes observations about our society – maintaining context, reproducibility, and accountability, to name a few, is critical to building trust and data reuse. Therefore, processes and tools which provides an ability for us to track the full process that the data has gone through in detail needs further attention. This is not only about factoring in methods to preserve provenance data but also using existing vocabularies or developing new ones where needed to particularly address statistical data.
By in large, interlinking that is currently done in Linked Dataspaces primarily deals with matching related concepts with one another. While this approach improves data quality for better discovery, further steps can be taken in this area. For instance, given the nature of statistical data, semantic comparison of datasets from different sources may establish a better understanding or relationships between observations e.g., how can we link one set of observations about a country’s GDP, and another set of observations which provides the corruption index in that region? Given this, there is a need to improve on interlinking approaches and the tools which devise them. One way of approaching the problem may be analysing or making sense of an observation as a whole as opposed to the comparison of atomic components e.g., SDMX dimensions.
References
- Design Issues, Linked Data, 2006, http://www.w3.org/DesignIssues/LinkedData.html
- Resource Description Framework (RDF): Concepts and Abstract Syntax - Graph Data Model, http://www.w3.org/TR/rdf-concepts/#section-data-model
- FOAF, http://xmlns.com/foaf/spec
- RDF Data Cube vocabulary, http://www.w3.org/TR/vocab-data-cube/
- SKOS Simple Knowledge Organization System, http://www.w3.org/2004/02/skos/
- DCMI Metadata Terms, http://dublincore.org/documents/dcmi-terms/
- Describing Linked Datasets with the VoID Vocabulary, http://www.w3.org/TR/void/
- http://www.scb.se/Pages/List____314011.aspx
- Statistical Data and Metadata eXchange, http://sdmx.org/
- http://data.gov.uk/
- http://www.insee.fr/en/default.asp
- http://www.bls.gov/
- http://www.eea.europa.eu/
- http://www.ine.es/en/welcome_en.htm
- http://imf.org/
- http://www.w3.org/2011/gld/wiki/GLD_Life_cycle
- http://linked-data-life-cycles.info/
- http://datalift.org/
- http://ontowiki.net/
- https://github.com/AKSW/cubeviz.ontowiki
- http://aksw.org/Projects/limes
- http://ec.europa.eu/information_society/digital-agenda/scoreboard/index_en.htm
- http://data.lod2.eu/scoreboard/
- http://code.google.com/p/google-refine/
- http://lab.linkeddata.deri.ie/2010/grefine-rdf-extension/
- http://lod2.eu/
- http://cso.ie/
- http://www.beyond2020.com/
- http://ec.europa.eu/eurostat
- http://epp.eurostat.ec.europa.eu/NavTree_prod/everybody/BulkDownloadListing
- http://worldbank.org/
- http://data.worldbank.org/data-catalog
- http://data.worldbank.org/developers/climate-data-api
- http://data.worldbank.org/data-catalog/world-development-indicators
- https://finances.worldbank.org/
- http://data.worldbank.org/data-catalog/projects-portfolio
- http://code.google.com/p/ldspider/
- http://marbles.sourceforge.net/
- http://neologism.deri.ie/
- http://d2rq.org/
- http://jena.apache.org/documentation/tdb/index.html
- http://jena.apache.org/documentation/serving_data/index.html
- http://virtuoso.openlinksw.com/
- http://www.openrdf.org/
- http://4store.org/
- http://jena.apache.org/documentation/tdb/optimizer.html
- http://www4.wiwiss.fu-berlin.de/bizer/silk/
- http://aksw.org/Projects/DLLearner
- http://incubator.apache.org/stanbol/
- http://aksw.org/projects/LODStats
- http://code.google.com/p/callimachus/
- http://code.google.com/p/linked-data-api/
- http://ode.openlinksw.com/
- http://www4.wiwiss.fu-berlin.de/pubby/
- http://data-gov.ie/
- http://worldbank.270a.info/
- http://www.w3.org/TR/sparql11-service-description/
- https://github.com/csarven/graphpusher
- http://www.w3.org/2001/sw/DataAccess/proto-wd/saddle.html
- http://darq.sourceforge.net/
- http://lod-cloud.net/
- http://openjena.org/wiki/SOH
- http://www.w3.org/TR/sparql11-http-rdf-update/
- http://librdf.org/raptor/rapper.html
- http://www.apache.org/licenses/LICENSE-2.0
- http://virtuoso.openlinksw.com/rdf-quad-store/
- http://www.w3.org/2005/04/fresnel-info/
- http://less.aksw.org/
- http://code.google.com/p/paget/
- http://www.w3.org/TR/rdf-sparql-query/#describe
- https://github.com/csarven/linked-data-pages
- http://code.google.com/p/moriarty/
- https://github.com/semsol/arc2
- https://csarven.ca/how-to-create-a-linked-data-site
- http://beyond2020.cso.ie/census/ReportFolders/ReportFolders.aspx
- http://reference.data.gov.uk/doc/year
- http://reference.data.gov.uk/id/gregorian-interval/
- http://www.iso.org/iso/country_codes/background_on_iso_3166/iso_3166-2.htm
- Dodds L., Davis, I.: Linked Data Patterns, 2012, http://patterns.dataincubator.org/book/
- http://sdmx.org/wp-content/uploads/2009/01/02_sdmx_cog_annex_2_cl_2009.pdf
- http://librdf.org/
- http://www.oracle.com/technetwork/products/berkeleydb/overview/index.html
- http://saxon.sourceforge.net/
- http://www.currency-iso.org/iso_index/iso_tables/iso_tables_a1.htm
- http://www.cso.ie/en/aboutus/dissemination/re-useofpublicsectorinformation/
- http://epp.eurostat.ec.europa.eu/portal/page/portal/about_eurostat/policies/copyright_licence_policy
- https://creativecommons.org/publicdomain/zero/1.0/
- http://go.worldbank.org/OJC02YMLA0
- http://data-gov.ie/.well-known/void
- http://worldbank.270a.info/.well-known/void
- https://google-developers.appspot.com/chart/
- http://eurostat.linked-statistics.org/
- http://data-gov.ie/sparql
- http://eurostat.linked-statistics.org/sparql
- http://worldbank.270a.info/sparql
- http://data-gov.ie/data/
- http://eurostat.linked-statistics.org/data/
- http://worldbank.270a.info/data/
- https://github.com/data-gov-ie/cso2rdf
- https://github.com/LATC/EU-data-cloud
- https://github.com/csarven/worldbank-linkeddata
- http://thedatahub.org/dataset/data-gov-ie
- http://thedatahub.org/dataset/the-eurostat-linked-data
- http://thedatahub.org/dataset/world-bank-linked-data
Bibliography
- Franklin, M., Halevy, A., Maier, D.: From databases to dataspaces: a new abstraction for information management, SIGMOD Record Volume 34 Issue 4, 27–33 2005, http://dl.acm.org/citation.cfm?id=1107502
- Halevy A., Franklin, M., Maier, D.: Principles of dataspace systems, 2006, http://dl.acm.org/citation.cfm?id=1142352
- Madhavan, J., Jeffery, S. R., Cohen, S., Dong, X., Ko, D., Yu, C,. Halevy, A.: Web-scale Data Integration: You can only afford to Pay As You Go, 2007, http://www.cidrdb.org/cidr2007/papers/cidr07p40.pdf
- Cyganiak, R., Hausenblas, M., McCuirc, E.: Official Statistics and the Practice of Data Fidelity, 2011, http://www.springerlink.com/content/t2244913r2583jw1/, ISBN 9781461417668.
- Cyganiak, R., Field, S., Gregory, A., Halb, W., Tennison, J.: Semantic Statistics: Bringing Together SDMX and SCOVO, LDOW, 2010,http://events.linkeddata.org/ldow2010/papers/ldow2010_paper03.pdf
- Hausenblas, M., Halb, W., Raimond, Y., Feigenbaum, L., Ayers, D.: SCOVO: Using Statistics on the Web of Data, ESWC, 2009,http://sw-app.org/pub/eswc09-inuse-scovo.pdf
- Hyland, B., Wood, D.: The Joy of Data - A Cookbook for Publishing Linked Government Data on the Web, 2011, http://www.springerlink.com/content/n30nq362wr678101/
- Villazón-Terrazas, B., Vilches-Blázquez, L.M., Corcho, O., and Gómez-Pérez, A.: Methodological Guidelines for Publishing Government Linked Data, 2011, http://www.springerlink.com/content/v1h0327g0002255h/
- Auer, S., Lehmann, J., Ngonga Ngomo, A.-C.: Introduction to Linked Data and Its Lifecycle on the Web, 2012, http://www.springerlink.com/content/e7tm13602t645k3q/
- Mynarz, J., Cyganiak, R., Iqbal, A., Hausenblas, M.: Modelling of Statistical Linked Data., Znalosti 2011: sborník příspěvků 10. ročníku konference, Stará Lesná, 31. 1. - 2. 2. 2011. Ostrava: VŠB TU, 2011. ISBN 978-80-248-2369-0.
- Freitas, A., Curry, E., Oliveira, J. G., O’Riáin, S.: Querying Heterogeneous Datasets on the Linked Data Web: Challenges, Approaches, and Trends, IEEE Internet Computing, vol. 16, no. 1, pp. 24–33, 2012, http://www.edwardcurry.org/publications/freitas_IC_12.pdf
- Umbrich, J., Karnstedt, M., Parreira, J. X., Polleres, A., Hauswirth, M.: Linked Data and Live Querying for Enabling Support Platforms for Web Dataspaces, DESWEB, 2012, http://www.polleres.net/publications/umbr-etal-2012DESWEB.pdf
- Omitola, T., Gibbins, N., Shadbolt, N.: Provenance in Linked Data Integration, Future Internet Assembly, 2010, http://linkeddata.future-internet.eu/images/e/eb/FIA2010_Provenance_in_the_Future_Internet.pdf
- Idehen, K., Erling, O.: Linked Data Spaces & Data Portability, LDOW, 2008, http://events.linkeddata.org/ldow2008/papers/20-idehen-erling-linked-data-spaces.pdf
- Heath, T., Bizer, C.: Linked data: evolving the Web into a global data space, 2011, http://linkeddatabook.com/, ISBN 9781608454303
- Salas, P. E. R., Da Mota, F. M., Martin, M., Auer, S., Breitman, K., Casanova, M. A.: Publishing Statistical Data on the Web, ESWC, 2012, http://svn.aksw.org/papers/2012/ESWC_PublishingStatisticData/public.pdf
- Martin, M., Nuffelen, B. van, Abruzzini, S., Auer, S.: The Digital Agenda Scoreboard: an statistical anatomy of Europe’s way into the information age, Submitted to Semantic Web Journal 2012, http://www.semantic-web-journal.net/sites/default/files/swj283.pdf
- John, S., Tennison, J.: Linking UK government data, LDOW, 2010, http://events.linkeddata.org/ldow2010/papers/ldow2010_paper14.pdf
- Maali, F.: Getting to the Five-Star: From Raw Data to Linked Government Data, National University of Ireland, Galway, 2011, https://docs.google.com/file/d/0B-jAmahMEbtJYjQ4OGIyM2EtMmZjOC00ODYwLWI2YTUtMDJkN2YwZTA0N2My/edit?hl=en
- Maali, F., Cyganiak, R., Peristeras, V.: A Publishing Pipeline for Linked Government Data, ESWC, 2012, http://www.springerlink.com/index/V45X551323V21536.pdf
- Mynarz, J.: Linked Open Data for Public Sector Information, Charles University Prague, 2012, http://headtoweb.posterous.com/linked-open-data-for-public-sector-informatio
- Hassanzadeh, O., Kementsietsidis, A., Lim, L., Miller R. J., Wang, M.: LinkedCT: A Linked Data Space for Clinical Trials, 2009, http://arxiv.org/pdf/0908.0567
- Curry, E.: System of Systems Information Interoperability using a Linked Dataspace, IEEE 7th International Conference on System of Systems Engineering (SOSE 2 2012), 2012, pp. 101–106, http://www.edwardcurry.org/publications/Curry_LinkedDataspaceForSOS_SOSE.pdf
- Auer, S., Tramp, S., Nuffelen, B., Isele, R., Lehmann, J., B., Bühmann, L., Dirschl, C., Mendes, P., Williams, H., Erling, O., Hausenblas, M.: Managing the life-cycle of Linked Data with the LOD2 Stack, ISWC, 2012, http://svn.aksw.org/lod2/Paper/ISWC2012-InUse_LOD2-Stack/public.pdf
- Designing URI sets for the UK public sector: a report from the Public Sector Information Domain of the CTO Council’s Cross-Government Enterprise Architecture, 2009, http://www.cabinetoffice.gov.uk/sites/default/files/resources/designing-URI-sets-uk-public-sector.pdf
- Ngonga Ngomo, A.-C.: A Time-Efficient Hybrid Approach to Link Discovery, The Sixth International Workshop on Ontology Matching, ISWC, 2011, http://www.dit.unitn.it/~p2p/OM-2011/om2011_Tpaper1.pdf
- Demter, J., Auer, S., Martin, M., Lehmann, J.: LODStats – An Extensible Framework for High-performance Dataset Analytics, EKAW, 2012, http://svn.aksw.org/papers/2011/RDFStats/public.pdf
Interactions
2 interactions
 Giovanni Tummarello replied on
didnt have time to look at the content yet but in the meanwhile sincere kudos for putting all this online and with a comment feature :) really cool Gio
 Amrapali Zaveri replied on
Really good thesis !