Linked Statistical Data Analysis
- Identifier
- https://csarven.ca/linked-statistical-data-analysis
- Published
- Modified
- License
- CC BY 4.0
- In Reply To
- SemStats 2013 Call for Papers
- Appeared In
- CEUR (Central Europe workshop proceedings): Proceedings of the 1st International Workshop on Semantic Statistics, Volume 1549, urn:nbn:de:0074-1549-5
- Purpose
- A path to using federated queries, statistical analyses and reuse of statistical linked data.
Abstract
Linked Data design principles are increasingly employed to publish and consume high-fidelity, heterogeneous statistical datasets in a distributed fashion. While vast amounts of linked statistics are available, access and reuse of the data is subject to expertise in corresponding technologies. There exists no user-centred interfaces for researchers, journalists and interested people to compare statistical data retrieved from different sources on the Web. Given that the RDF Data Cube vocabulary is used to describe statistical data, its use makes it possible to discover and identify statistical data artefacts in a uniform way. In this article, the design and implementation of a user-centric application and service is presented. Behind the scene, the platform uses federated SPARQL queries to gather statistical data from distributed data stores. The R language for statistical computing is employed to perform statistical analyses and visualizations. The Shiny application and server bridges the front-end Web user interface with R on the server-side in order to compare statistical macrodata, and stores analyses results in RDF for future research. As a result, distributed linked statistics with accompanying provenance data can be more easily explored and analysed by interested parties.
Keywords
Introduction
Statistical data artefacts and the analyses conducted on the data are fundamental for testing scientific theories about our society and the universe we live in. As statistics are often used to add credibility to an argument or advice, they influence the decisions we make. The decisions are, however, complex beings on their own with multiple variables based on facts, cognitive processes, social demands, and maybe even factors that are unknown to us. In order for the society to track and learn from its own vast knowledge about events and things, it needs to be able to gather statistical information from heterogeneous and distributed sources. This is to uncover insights, make predictions, or build smarter systems that society needs to progress.
Due to a range of technical challenges, development teams often face low-level repetitive statistical data management tasks with partial tooling at their disposal. These challenges on the surface include: data integration, synchronization, and access in a uniform way. In addition, designing user-centric interfaces for data analysis that is functionally consistent (i.e., improving usability and learning), reasonably responsive, provenance friendly (e.g., fact checkable) still requires much attention.
This brings us to the core of our research challenge: How do we reliably acquire statistical data in a uniform way and conduct well-formed analyses that are easily accessible and usable by citizens, meanwhile strengthening trust between the user and the system?
This article presents an approach, Statistical Linked Data Analyses, addressing this challenge. In a nutshell, it takes advantage of Linked Data design principles that are widely accepted as a way to publish and consume data without central coordination on the Web. The work herein offers a Web based user-interface for researchers, journalists, or interested people to compare statistical data from different sources against each other without having any knowledge of the technology underneath or the expertise to develop themselves. Our approach is based on performing decentralized (i.e. federated) structured queries to retrieve data from various SPARQL endpoints, conducting various data analyses, and providing analysis results back to the user. For future research, analyses are stored so that they can be discovered and reused.
We have an implementation of a statistical analyses service at stats.270a.info [1] which addresses the challenge and realizes the approach. The service is intended to allow humans and machines explore statistical analyses. There are two additional products of this service: first, the analysis results are stored for future discovery, and second, it creates valuable statistical artefacts which can be reused in a uniform way.
As a result, we demonstrate with this work, how linked data principles can be applied to statistical data. We show in particular, that federated SPARQL queries facilitate novel statistical analyses, which previously required cumbersome manual statistical data integration efforts. The automatized integration and analysis workflow also enables provenance tracing from visualizations combining statistical data from various sources back to the original raw data.
Background and Related Work
As we discussed already in Statistical Linked Dataspaces [2] linked statistics enable queries across datasets: Given that the dimension concepts are interlinked, one can learn from a certain observation's dimension value, and enable the automation of cross-dataset queries.
The RDF Data Cube vocabulary [3] is used to describe multi-dimensional statistical data, along with SDMX-RDF as one of the statistical information models. It makes it possible to represent significant amounts of heterogeneous statistical data as Linked Data where they can be discovered and identified in a uniform way. The statistical artefacts that use this vocabulary, are invaluable for statisticians, researchers, and developers.
Linked SDMX Data [4] provided templates and tooling to transform SDMX-ML data from statistical agencies to RDF/XML, resulting in linked statistical datasets at 270a.info [5] using the RDF Data Cube vocabulary. In addition to semantically uplifting the original data, information pertaining provenance was kept track using the PROV Ontology [6] at transformation time, while incorporating retrieval time provenance data.
Performing Statistical Methods on Linked Data [7] investigated simple statistical calculations, such as linear regression and presented the results using R [8] and SPARQL queries. It highlighted the importance of a wide range of typical issues on data integration for heterogeneous statistical data. The other technical issues raised are SPARQL query performance, and the use of a central SPARQL endpoint, which contained multiple data sources. For future work, the work pointed out a friendly user-interface that allows dataset selection, statistical method and a visualization of the results.
Defining and Executing Assessment Tests on Linked Data for Statistical Analysis [9] explains: identification of data items, analysis of data characteristics, and data matching as key requirements to conduct statistical analysis on integrated Linked Data.
Linked Open Piracy: A story about e-Science, Linked Data, and statistics [10] investigated analysis and visualization of piracy reports to answer domain questions through a SPARQL client for R [11].
Towards Next Generation Health Data Exploration: A Data Cube-based Investigation into Population Statistics for Tobacco [12], presents the qb.js [13] tool to explore data that is expressed as RDF Data Cubes. It is designed to formulate and explore hypotheses. Under the hood, it makes a SPARQL query to an endpoint which contains the data that it analyzes.
Publishing Statistical Data on the Web [14] explains CubeViz [15], which was developed to visualize multidimensional statistical data. It is a faceted browser, which uses the RDF Data Cube vocabulary, with a chart visualization component. The inspection and results are for a single dataset.
Google Public Data Explorer [16], derived from the Gapminder [17] tool, displays statistical data as line graphs, bar graphs, cross sectional plots or on maps. The process to display the data requires the data to be uploaded in CSV format, and accompanying Dataset Publishing Language (DSPL) [18] in XML to describe the data and metadata of the datasets. Its visualizations and comparisons are based on one dataset at a time.
Generating Possible Interpretations for Statistics from Linked Open Data [19] talks about Explain-a-LOD [20] tool which focuses on generating hypotheses that explain statistics. It has a configuration to compare two variables, and then provides possible interpretations of the correlation analysis for users to review.
Looking at this state-of-the-art, we can see that the analyses are commonly conducted on central repositories. As statistical Linked Data is published by different parties independently from one another, it is only reasonable to work towards a solution that can gather, integrate and analyse the data without having to resort to centralism.
Analysis platform for Linked Statistical Data
Our analysis platform focuses on two goals: 1) a Web user interface for researchers to compare macrodata observations and to view plots and analysis results, 2) caching and storage of analyses for future research and reuse. Here, we describe the platform at stats.270a.info. Figure [1] shows the architecture for Linked Stats Analysis.
Functional Requirements
The requirements for functionality and performance are that Linked Data design principles are employed behind the scenes to pull in the statistical data that are needed to conduct analyses, and to make the results of the analyses available using the same methods for both, humans and machines. While achieving this workflow includes many steps, the front-end interface for humans should aim for minimum interactivity that is required to accomplish this. Finally, the performance of the system should be reasonable for a Web user interface, as it needs to present the analysis and display visualizations. Additionally, essential parts of the analyses should be cached and stored for future use both, for application responsiveness and data discovery. Finally and most importantly, the interface needs to foster trust while presenting the analyses. Therefore, the interface should be accompanied with data provenance and provide sufficient detail for the user.
User interface
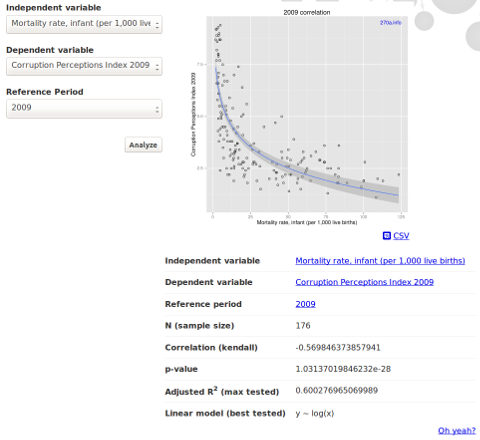
A web application was created to provide users with a simple interface to conduct regression analysis and display of scatter plots. In the case of regression analysis, the interface presents three drop-down selection areas for the user: an independent variable, a dependent variable, and a time series. Both, the independent and dependent variables are composed of a list of datasets with observations, and time series are composed of reference periods of those observations. Upon selecting and submitting datasets to compare, the interface then presents a scatter plot with a line of best fit from a list of tested linear models. Figure [2] shows a screenshot of the user interface. The points in the scatter plot represent locations, in this case countries, which happen to have a measure value for both variables as well as the reference period that was selected by the user. Below the scatter-plot, a table of analysis results is presented.
The datasets are compiled by gathering qb:DataSets (an RDF Data Cube class for datasets) from each statistical dataspace at 270a.info. Similarly, the reference periods are derived from calendar intervals e.g., YYYY, YYYY-MM-DD or YYYY-QQ.
Provenance
In order to foster trust and confidence for the user, the human-centred interface as well as the machine-friendly representation of the data accompanies provenance data. On the analysis interface, an Oh yeah?
link guides users to a page about the provenance activity for the information. These previously generated provenance activities provide links to all data sources which were used for the analysis, query construct for data aggregation, as well as metadata about the used tools, assigned license, production timestamps, and responsible agents for the generated analysis. Thus, in addition to analysis metadata, the user is able to track the data all the way back to its origins (at the statistical agencies), and reproduce or compare their results.
Comparability
At this time, the majority of the interlinks in Linked Open Data between statistical concepts (i.e. reference areas) are determined based on their notations and labels. In order to precisely measure the differences between statistical concepts, the following should be factored in: temporality, geographic areas, domains, and drifts, as mentioned in Data quality in information systems [21], and What Is Concept Drift and How to Measure It? [22]. In practice for instance, this means that a reference area from a particular reference period is not necessarily the same concept as another one found elsewhere, without incorporating some of these characteristics. To take an example, if an observation has a reference area dimension value as RU (Russia) with reference period 2013, the question is, to what degree can that particular observation be compared or used with another observation with the same reference area value, but with a reference period between 1922–1991 – given that latter reference area historically corresponds to USSR (Union of Soviet Socialist Republics) and is different from RU. If this sort of metadata is not provided by statistical services or incorrectly represented in the data, it is worthwhile to account for it, either when interlinks are made across code lists or when the observations from different data sources are used together. Additionally, all assumptions and accuracies should be documented.
Data Requirements
Our expectation regarding the data is that it is modeled using the RDF Data Cube vocabulary and is well-formed. Specifically, it needs to pass some of the integrity constraints as outlined by the vocabulary specification. For our application, some of the essential checks are that: 1) a unique data structure definition (DSD) is used for a dataset, 2) the DSD includes a measure (value of each observation), 3) concept dimensions have code lists, and 4) codes are from the code lists.
In addition to well-formedness, to compare variables from two datasets, there needs to be an agreement on the concepts that are being matched for in respective observations. In the case of regression analysis, the primary concern is about reference areas (i.e. locations), and making sure that the comparison made for the observations from datasetx (independent variable) and datasety (dependent variable) are using concepts that are interlinked (using the property skos:exactMatch). Practically, a concept, for example Switzerland, from at least one of the dataset's code lists should have an arc to the other dataset's concept. It ensures that there is a reliable degree of confidence that the particular concept is interchangeable. Hence, the measure corresponding to the phenomenon being observed, is about the same location in both datasets. Concepts in the datasets were interlinked using the LInk discovery framework for MEtric Spaces (LIMES) [23]. Figure [3] shows outbound interlinks for the datasets at https://270a.info/.
One additional requirement from the datasets is that the RDF Data Cube component properties (e.g., dimensions, measures) either use sdmx-dimension:refArea, sdmx-dimension:refPeriod, sdmx-measure:obsValue directly or respective sub-properties (rdfs:subPropertyOf). Given decentralized mappings of the statistical datasets (published as SDMX-ML), their commonality is expected to be the use, or a reference to SDMX-RDF properties in order to achieve generalized federated queries without having complete knowledge of the structures of the datasets, but rather only the essential bits.
In order to proceed with the analysis, we use the selections made by the user: datasetx and datasety, reference period, and then gather all observations with corresponding reference areas, and measures. Only the observations with reference areas which have a interlinks are retained in the final result.
Application
The R package Shiny [24] along with Shiny server [25] is used to build an interactive web application. A Shiny application was built to essentially allow an interaction between the front-end Web application and R. User inputs are set to trigger an event which is sent to the Shiny server and handled by the application written in R. While the application uses R for statistical analysis and visualizations, to achieve the goals of this research, other statistical computing software can be used. The motivation to use R is due to it being a popular open-source software for statistical analysis and it being a requirement of Shiny server.
The application assembles a SPARQL query using the input values and then sends them to the SPARQL endpoint at stats.270a.info/sparql, which dispatches federated queries to the two SPARQL endpoints where the datasets are located. The SPARQL query request is handled by the SPARQL client for R. The query results are retrieved and given to R for statistical data analysis. R generates a scatter plot containing the independent and dependent variable, where each point in the chart is a reference area (e.g., country) for that particular reference period selection. Regression analysis is done where correlation, p-value, and the line of best fit is determined after testing several linear models, and shown in the user interface.
Federated Queries
During this research, establishing a correct and reasonably performing federated querying was one of the most challenging steps. This was due in part by ensuring dataset integrity, finding a balance between processing and filtering applicable observations at remote endpoints and at the originating endpoint. The challenge was compromising between what should be processed remotely and sent over the wire versus handling some of that workload by the parent endpoint. Since one of the requirements was to ensure that the concepts are interlinked at either one of the endpoints (in which case, it is optional per endpoint), each endpoint had to include each observation's reference area as well as its interlinked concept. The result from both endpoints was first joined and then filtered in order to avoid false negatives. That is, either conceptx has a skos:exactMatch relationship to concepty, or vice versa, or conceptx and concepty are the same. One quick and simple way to minimize the number of results was to filter out exact matches at each endpoint which did not contain the other dataset's domain name. Hence, minimizing the number of join operations which had to be handled by the parent endpoint.
In order to put the cost of queries briefly into perspective i.e., the conducted tests and sample sizes of the dataspaces that were used; the total number of triples (including observations and metadata) per endpoint are: 50 thousand (Transparency International [26]), 54 million (Food and Agriculture Organization of the United Nations [FAO] [27]), 305 million (Organisation for Economic Co-operation and Development [OECD] [28]), 221 million (World Bank [29]), 470 million (European Central Bank [ECB] [30]), 36 million (International Monetary Fund [IMF] [31]).
The anatomy of the query is shown in Figure [3]. The SPARQL Endpoint and the dataset URIs are the only requirements. The structure of the statements and operations tries to get the most out of Apache Jena's [32] TDB storage system [33], TDB Optimizer [34] and Fuseki [35] SPARQL endpoints. Better performing queries can be achieved by knowing the predicate frequency upfront, and ordering them in for a dataset to avoid processing of false negatives.
SELECT DISTINCT ?refAreaY ?x ?y ?identityX ?identityYWHERE {SERVICE <http://example.org/sparql> {SELECT DISTINCT ?identityX ?refAreaX ?refAreaXExactMatch ?measureXWHERE {?observationX qb:dataSet <http://example.org/dataset/X> .?observationX ?propertyRefPeriodX exampleRefPeriod:1234 .?propertyRefAreaX rdfs:subPropertyOf* sdmx-dimension:refArea .?observationX ?propertyRefAreaX ?refAreaX .?propertyMeasureX rdfs:subPropertyOf* sdmx-measure:obsValue .?observationX ?propertyMeasureX ?x .<http://example.org/dataset/X>qb:structure/stats:identityDimension ?propertyIdentityX .?observationX ?propertyIdentityX ?identityX .OPTIONAL {?refAreaX skos:exactMatch ?refAreaXExactMatch .FILTER (STRSTARTS(STR(?refAreaXExactMatch), "http://example.net/"))}}}SERVICE <http://example.net/sparql> {SELECT DISTINCT ?identityY ?refAreaY ?refAreaYExactMatch ?measureYWHERE {?observationY qb:dataSet <http://example.net/dataset/Y> .?observationY ?propertyRefPeriodY exampleRefPeriod:1234 .?propertyRefAreaY rdfs:subPropertyOf* sdmx-dimension:refArea .?observationY ?propertyRefAreaY ?refAreaY .?propertyMeasureY rdfs:subPropertyOf* sdmx-measure:obsValue .?observationY ?propertyMeasureY ?y .<http://example.net/dataset/Y>qb:structure/stats:identityDimension ?propertyIdentityY .?observationY ?propertyIdentityY ?identityY .OPTIONAL {?refAreaY skos:exactMatch ?refAreaYExactMatch .FILTER (STRSTARTS(STR(?refAreaYExactMatch), "http://example.org/"))}}}FILTER (SAMETERM(?refAreaYExactMatch, ?refAreaX)|| SAMETERM(?refAreaXExactMatch, ?refAreaY)|| SAMETERM(?refAreaY, ?refAreaX))}
For the time being, the use of named graphs in the SPARQL queries were excluded for a good reason. For federated queries to work with the goal of minimal knowledge about store organization, the queries had to work without including graph names. However, by employing the Vocabulary of Interlinked Datasets (VoID) [36], it is possible to extract both, the location of the SPARQL endpoint, as well as the graph names within. This is left as a future enhancement.
As statistical datasets are multi-dimensional, slicing the datasets with only reference area and reference period are insufficient to distinguish records. It is likely that there would be duplicate results if we leave the column order to reference area, measurex, measurey. For this reason, there is an additional expectation from the datasets indicating one other dimension to group the observations with. This grouping is also used to display faceted scatter-plots.
Recommendations from On the Formulation of Performant SPARQL Queries [37] and Querying over Federated SPARQL Endpoints — A State of the Art Survey [38] were applied where applicable.
Analysis caching and storing
In order to optimize application reactivity for all users, previously user selected options for analysis are cached in the Shiny server session. That is, the service is able to provide cached results which were triggered by different users.
In addition to a cache that is closest to the user, results from the federated queries as well as the R analysis, which was previously conducted, is stored back into the RDF store with a SPARQL Update. This serves multiple purposes. In the event that the Shiny server is restarted and the cache is no longer available, previously calculated results in the store can be reused, which is still more cost efficient than making new federated queries.
Another reason for storing the results back in the RDF store is to offer them over the stats.270a.info SPARQL endpoint for additional discovery and reuse of analysis for researchers. Interesting use cases from this approach emerge immediately. For instance, a researcher or journalist can investigate analysis that meets their criteria. Some examples are as follows:
- analysis which is statistically significant, and has to do with Gross Domestic Product (GDP) and health subjects,
- a list of indicator pairs with strong correlations,
- using the line of best fit of a regression analysis to predict or forecast possible outcomes,
- countries which have less mortality rate than average with high corruption.
URI patterns
The design pattern for analyses URIs are aimed to keep the length as minimal as possible, while leaving a trace to encourage self exploration and reuse. The general URI pattern with base http://stats.270a.info/analysis/ is as follows for regression analysis:
{independentVariable}/{dependentVariable}/{referencePeriod}
As URIs for both independent and dependent variable are based on datasets, and the reference period is codified, their prefixed names are used instead in the analysis URI to keep them short and friendly:
{prefix}:{dataset}/{prefix}:{dataset}/{prefix}:{refPeriod}
For example, the URI http://stats.270a.info/analysis/worldbank:SP.DYN.IMRT.IN/transparency:CPI2009/year:2009 refers to an analysis which entails the infant mortality rate from the World Bank dataset as the independent variable, 2009 corruption perceptions index from the Transparency International dataset as the dependent variable, and reference interval for year 2009. The variable values are prefixed names, which correspond to their respective datasets, i.e., worldbank:SP.DYN.IMRT.IN becomes http://worldbank.270a.info/dataset/SP.DYN.IMRT.IN, and transparency:CPI2009 becomes http://transparency.270a.info/dataset/CPI2009 when processed.
Vocabularies
Besides the common vocabularies: RDF, RDFS, XSD, OWL, the RDF Data Cube vocabulary is used to describe multi-dimensional statistical data, and SDMX-RDF for the statistical information model. PROV-O is used for provenance coverage.
A statistical vocabulary (http://stats.270a.info/vocab)[39] is created to describe analyses. It contains classes for analyses, summaries and each data row that is retrieved. Some of the properties include: graph (e.g., scatter plot), independent and dependent variables, reference period, sample size, p-value, correlation value, correlation method that is used, adjusted R-squared, best model that is tested, reference area, measure values for both variables, and the identity concept for both variables.
Future plans for this vocabulary is to reflect back on the experience, and to consider alignment with Semanticscience Integrated Ontology (SIO) [40]. While SIO is richer, queries are more complex than necessary for simple analysis reuse at stats.270a.info.
Results
Putting it all together: following the Linked Data design principles, the platform for linked statistical data analyses is now available for different types of users. Human users with a Web browser can interact with the application with a few clicks. This is arguably the simplest approach for researchers and journalists without having to go down the development road. Additionally, humans as well as machines can consume the same analysis as an RDF or JSON serialization. In the case of JSON, the analyses can be used as part of a widget on a webpage. The Scalar Vector Graphics (SVG) format of the scatter plot can be used in articles on the Web. Storing the analyses permanently and having it accessible over a SPARQL endpoint opens up the possibility for researchers to discover interesting statistics. Finally, with the help of Apache Rewrites, Linked Data Pages [41] handles the top down direction of these requests and provides dereferenceable URIs for a follow your nose type of exploration. The source code [42] is available at a public repository.
Discussion and Evaluation
In order to test and experiment with the techniques outlined in our work, we postulate that the approaches to conduct federated queries to gather necessary data for analysis can be summarized by either constructing general or custom query patterns. The generalized approach is essentially where the same query pattern is used for all endpoints. The custom approach is where each endpoint gets a uniquely constructed query pattern.
The approach to writing general queries that can work over any endpoint which hosts well-formed statistical data passing the integrity checks of the RDF Data Cube vocabulary. Therefore, in this case, the queries do not consist of any predetermined information about the endpoint. The approach is essentially aimed towards the possibility to scale the number of endpoints within its reach. Achieving optimal query patterns tend to be challenging in this case.
In contrast, the custom approach will offer an improvement over the generalized approach when performance is in question, since it can factor in information about the data organization for each endpoint. This may typically include information like named graphs to look into, available interlinks, metadata about comparability and so on. When this information is available to the system in a controlled environment e.g., endpoint monitoring, industrial use-cases would benefit from the custom approach as performance of the system is essential.
For our research, the technique we focused on favoured the scalability of the system with minimal human intervention. This was achieved by having an implementation where by only making the system be aware of new statistical Linked Data endpoints, the rest of the pipeline and interface functioned as consistently as before. Having said that, it is worth repeating that it is not ideal if performance is top priority.
Conclusions and Future Work
We believe that the presented work here and the prior Linked SDMX Data effort contributed towards strengthening the relationship between Semantic Web / Linked Data and statistical communities. The stats.270a.info service is intended to allow humans and machines explore statistical analyses.
In the following we discuss some research and application areas that are planned in future work:
Making the query optimization file from Jena TDB available in RDF and at SPARQL endpoints (or placed in VoID along with LODStats [43]) can help to devise better performing federated queries.
With the availability of more interlinks across datasets, we can investigate analyses that are not dependent on reference areas. For instance, interlinking currencies, health matters, policies, or concepts on comparability can contribute towards various analyses.
Enriching the datasets with information on comparability can lead to achieving more coherent results. This is particularly important given that the European Statistics Code of Practice [44] from the European Commission lists Coherence and Comparability as one of the principles that national and community statistical authorities should adhere to. While the research at hand is not obligated to follow those guidelines, they are highly relevant for providing quality statistical analyses.
The availability of the analysis in a JSON serialization, and the cached scatter plot in SVG format, makes it possible for a webpage widget to use them. For instance, they can be dynamically used in articles or wiki pages with all references intact. As the Linked Data approach allows one to explore resources from one item to another, consumers of the article can follow the trace all the way back to the source. This is arguably an ideal scenario to show provenance and references for fact-checking in online or journal articles. Moreover, since the analysis is stored, and the queried data can also be exported in different formats, it can be reused to reproduce the results.
This brings us to an outlook for Linked Statistical Data Analyses. The reuse of Linked analyses artefacts as well as the approach to collect data from different sources can help us build smarter systems. It can be employed in fact-checking scenarios as well as uncovering decision-making processes, where knowledge from different sources is put to their potential use when combined.
Acknowledgements
Many thanks to colleagues whom helped one way or another during the course of this work (not implying any endorsement); in no particular order: Deborah Hardoon (Transparency International), Axel-Cyrille Ngonga Ngomo (Universität Leipzig, AKSW), Alberto Rascón (Berner Fachhochshule [BFS]), Michael Mosimann (BFS), Joe Cheng (RStudio, Inc.), Government Linked Data Working Group, Publishing Statistical Data group, Apache Jena, Andy Seaborne (Epimorphics Ltd), Richard Cyganiak (Digital Enterprise Research Institute [DERI]). And, DERI for graciously offering to host this work on their servers.
References
- stats.270a.info, http://stats.270a.info/
- Capadisli, S.: Statistical Linked Dataspaces. Master's thesis, National University of Ireland (2012), https://csarven.ca/statistical-linked-dataspaces
- The RDF Data Cube vocabulary, http://www.w3.org/TR/vocab-data-cube/
- Capadisli, S., Auer, S. Ngonga Ngomo, A.-C., Linked SDMX Data, Semantic Web Journal (2013), https://csarven.ca/linked-sdmx-data
- 270a.info, https://270a.info/
- The PROV Ontology, http://www.w3.org/TR/prov-o/
- Zapilko, B., Mathiak, B.: Performing Statistical Methods on Linked Data, Proc. Int'l Conf. on Dublin Core and Metadata Applications (2011), http://dcevents.dublincore.org/IntConf/dc-2011/paper/download/27/16
- The R Project for Statistical Computing, http://www.r-project.org/
- Zapilko, B., Mathiak, B.: Defining and Executing Assessment Tests on Linked Data for Statistical Analysis, COLD, ISWC (2011), http://iswc2011.semanticweb.org/fileadmin/iswc/Papers/Workshops/COLD/cold2011_submission_13.pdf
- Hage, W. R. v., Marieke v., Malaisé., V.: Linked Open Piracy: A story about e-Science, Linked Data, and statistics (2012), http://www.few.vu.nl/~wrvhage/papers/LOP_JoDS_2012.pdf
- SPARQL client for R, http://cran.r-project.org/web/packages/SPARQL/index.html
- McCusker, J. P., McGuinness, D. L., Lee, J., Thomas, C., Courtney, P., Tatalovich, Z., Contractor, N., Morgan, G., Shaikh, A.: Towards Next Generation Health Data Exploration: A Data Cube-based Investigation into Population Statistics for Tobacco, Hawaii International Conference on System Sciences (2012), http://www.hicss.hawaii.edu/hicss_46/bp46/hc6.pdf
- qb.js, http://orion.tw.rpi.edu/~jimmccusker/qb.js/
- Percy E. Rivera Salas, P. E. R., Mota, F. M. D., Martin, M., Auer, S., Breitman, K., Casanova, M. A.: Publishing Statistical Data on the Web, ISWC (2012), http://svn.aksw.org/papers/2012/ESWC_PublishingStatisticData/public.pdf
- CubeViz, http://aksw.org/Projects/CubeViz
- Google Public Data Explorer, http://www.google.com/publicdata/
- Gapminder, http://www.gapminder.org/
- Dataset Publishing Language, https://developers.google.com/public-data/
- Paulheim, H.: Generating Possible Interpretations for Statistics from Linked Open Data, ESWC (2012), http://www.ke.tu-darmstadt.de/bibtex/attachments/single/310
- Explain-a-LOD, http://www.ke.tu-darmstadt.de/resources/explain-a-lod
- Sundgren, B.: Data quality in information systems, Workshop on Data Quality (2013)
- Wang, S., Schlobach, S., Klein, M.C.A.: What Is Concept Drift and How to Measure It? In: Knowledge Engineering and Management by the Masses - 17th International Conference, EKAW 2010. Proceedings. pp. 241–256. Lecture Notes in Computer Science, 6317, Springer, (2010)http://link.springer.com/chapter/10.1007%2F978-3-642-16438-5_17
- Ngonga Ngomo, A.-C.: LInk discovery framework for MEtric Spaces (LIMES): A Time-Efficient Hybrid Approach to Link Discovery (2011), http://aksw.org/Projects/limes
- Shiny, http://www.rstudio.com/shiny/
- Shiny server, https://github.com/rstudio/shiny-server
- Transparency International, http://transparency.270a.info/
- Food and Agriculture Organization of the United Nations, http://fao.270a.info/
- Organisation for Economic Co-operation and Development, http://oecd.270a.info/
- World Bank, http://worldbank.270a.info/
- European Central Bank, http://ecb.270a.info/
- International Monetary Fund, http://imf.270a.info/
- Apache Jena, http://jena.apache.org/
- Jena TDB, http://jena.apache.org/documentation/tdb/index.html
- Jena TDB Optimizer, http://jena.apache.org/documentation/tdb/optimizer.html
- Jena Fuseki, https://jena.apache.org/documentation/serving_data/
- Vocabulary of Interlinked Datasets, http://www.w3.org/TR/void/
- Loizou, A., Groth, P.: On the Formulation of Performant SPARQL Queries, arXiv:1304.0567 (2013) http://arxiv.org/abs/1304.0567
- Rakhmawati, N.R., Umbrich, J., Karnstedt, M., Hasnain, A., Hausenblas, M.: Querying over Federated SPARQL Endpoints — A State of the Art Survey, arXiv:1306.1723 (2013) http://arxiv.org/abs/1306.1723
- Stats Vocab, http://stats.270a.info/vocab
- Semanticscience Integrated Ontology, http://semanticscience.org/ontology/sio.owl
- Linked Data Pages, https://csarven.ca/statistical-linked-dataspaces#linked-data-pages
- LSD Analysis code at GitHub, https://github.com/csarven/lsd-analysis
- Demter, J., Auer, S., Martin, M., Lehmann, J.: LODStats – An Extensible Framework for High-performance Dataset Analytics, EKAW (2012), http://svn.aksw.org/papers/2011/RDFStats/public.pdf
- European Statistics Code of Practice, http://ec.europa.eu/eurostat/web/products-manuals-and-guidelines/-/KS-32-11-955
Interactions
13 interactions
Kingsley Idehen replied on
Are you able to include some sample SPARQL-FED URLs ?
Andreas Kuckartz replied on
+Kingsley Idehen I somehow doubt that +Sarven Capadisli will see your question without this ping.
Sarven Capadisli replied on
+Kingsley Idehen Follow your nose. It is all there :)http://stats.270a.info/analysis/worldbank:SP.DYN.IMRT.IN/transparency:CPI2009/year:2009The "Oh yeah?" link (or see prov:wasGeneratedBy) is a PROV-O Activity:http://stats.270a.info/provenance/fa698e46868fe348865678884e89ef84b0be6c64See prov:used value:http://stats.270a.info/sparql?query=PREFIX%20xsd%3a%20%3chttp%3a%2f%2fwww.w3.org%2f2001%2fXMLSchema%23%3e%0aPREFIX%20rdfs%3a%20%3chttp%3a%2f%2fwww.w3.org%2f2000%2f01%2frdf-schema%23%3e%0aPREFIX%20owl%3a%20%3chttp%3a%2f%2fwww.w3.org%2f2002%2f07%2fowl%23%3e%0aPREFIX%20skos%3a%20%3chttp%3a%2f%2fwww.w3.org%2f2004%2f02%2fskos%2fcore%23%3e%0aPREFIX%20dcterms%3a%20%3chttp%3a%2f%2fpurl.org%2fdc%2fterms%2f%3e%0aPREFIX%20qb%3a%20%3chttp%3a%2f%2fpurl.org%2flinked-data%2fcube%23%3e%0aPREFIX%20sdmx%3a%20%3chttp%3a%2f%2fpurl.org%2flinked-data%2fsdmx%23%3e%0aPREFIX%20sdmx-dimension%3a%20%3chttp%3a%2f%2fpurl.org%2flinked-data%2fsdmx%2f2009%2fdimension%23%3e%0aPREFIX%20sdmx-measure%3a%20%3chttp%3a%2f%2fpurl.org%2flinked-data%2fsdmx%2f2009%2fmeasure%23%3e%0aPREFIX%20year%3a%20%3chttp%3a%2f%2freference.data.gov.uk%2fid%2fyear%2f%3e%0aPREFIX%20prov%3a%20%3chttp%3a%2f%2fwww.w3.org%2fns%2fprov%23%3e%0aPREFIX%20stats%3a%20%3chttp%3a%2f%2fstats.270a.info%2fvocab%23%3e%0aPREFIX%20provenance%3a%20%3chttp%3a%2f%2fstats.270a.info%2fprovenance%2f%3e%0a%20%0aSELECT%20DISTINCT%20%3frefAreaY%20%3fx%20%3fy%20%3fidentityX%20%3fidentityY%0aWHERE%20%7b%20%0a%20%20%20%20SERVICE%20%3chttp%3a%2f%2fworldbank.270a.info%2fsparql%3e%20%7b%0a%20%20%20%20%20%20%20%20SELECT%20DISTINCT%20%3fidentityX%20%3frefAreaX%20%3frefAreaXExactMatch%20%3fx%0a%20%20%20%20%20%20%20%20WHERE%20%7b%0a%20%20%20%20%20%20%20%20%20%20%20%20%3fobservationX%20qb%3adataSet%20%3chttp%3a%2f%2fworldbank.270a.info%2fdataset%2fSP.DYN.IMRT.IN%3e%20.%0a%20%20%20%20%20%20%20%20%20%20%20%20%3fobservationX%20%3fpropertyRefPeriodX%20%3chttp%3a%2f%2freference.data.gov.uk%2fid%2fyear%2f2009%3e%20.%0a%20%20%20%20%20%20%20%20%20%20%20%20%3fpropertyRefAreaX%20rdfs%3asubPropertyOf*%20sdmx-dimension%3arefArea%20.%0a%20%20%20%20%20%20%20%20%20%20%20%20%3fobservationX%20%3fpropertyRefAreaX%20%3frefAreaX%20.%0a%20%20%20%20%20%20%20%20%20%20%20%20%3fpropertyMeasureX%20rdfs%3asubPropertyOf*%20sdmx-measure%3aobsValue%20.%0a%20%20%20%20%20%20%20%20%20%20%20%20%3fobservationX%20%3fpropertyMeasureX%20%3fx%20.%0a%0a%20%20%20%20%20%20%20%20%20%20%20%20%3chttp%3a%2f%2fworldbank.270a.info%2fdataset%2fSP.DYN.IMRT.IN%3e%20qb%3astructure%2fstats%3aidentityDimension%20%3fpropertyIdentityX%20.%0a%20%20%20%20%20%20%20%20%20%20%20%20%3fobservationX%20%3fpropertyIdentityX%20%3fidentityX%20.%0a%0a%20%20%20%20%20%20%20%20%20%20%20%20OPTIONAL%20%7b%0a%20%20%20%20%20%20%20%20%20%20%20%20%20%20%20%20%3frefAreaX%20skos%3aexactMatch%20%3frefAreaXExactMatch%20.%0a%20%20%20%20%20%20%20%20%20%20%20%20%20%20%20%20FILTER%20(REGEX(STR(%3frefAreaXExactMatch),%20%22%5ehttp%3a%2f%2ftransparency.270a.info%2f%22))%0a%20%20%20%20%20%20%20%20%20%20%20%20%7d%0a%0a%20%20%20%20%20%20%20%20%20%20%20%20%3frefAreaX%20skos%3anotation%20%3frefAreaCodeX%20.%0a%20%20%20%20%20%20%20%20%20%20%20%20FILTER%20(!REGEX(%3frefAreaCodeX,%20%22%5e%5b0-9%5d%22))%0a%23%20%20%20%20%20%20%20%20%20%20%20%20FILTER%20(DATATYPE(%3fx)%20%3d%20xsd%3adecimal%20%7c%7c%20DATATYPE(%3fx)%20%3d%20xsd%3adouble)%0a%20%20%20%20%20%20%20%20%7d%0a%20%20%20%20%7d%0a%20%20%20%20SERVICE%20%3chttp%3a%2f%2ftransparency.270a.info%2fsparql%3e%20%7b%0a%20%20%20%20%20%20%20%20SELECT%20DISTINCT%20%3fidentityY%20%3frefAreaY%20%3frefAreaYExactMatch%20%3fy%0a%20%20%20%20%20%20%20%20WHERE%20%7b%0a%20%20%20%20%20%20%20%20%20%20%20%20%3fobservationY%20qb%3adataSet%20%3chttp%3a%2f%2ftransparency.270a.info%2fdataset%2fCPI2009%3e%20.%0a%20%20%20%20%20%20%20%20%20%20%20%20%3fobservationY%20%3fpropertyRefPeriodY%20%3chttp%3a%2f%2freference.data.gov.uk%2fid%2fyear%2f2009%3e%20.%0a%20%20%20%20%20%20%20%20%20%20%20%20%3fpropertyRefAreaY%20rdfs%3asubPropertyOf*%20sdmx-dimension%3arefArea%20.%0a%20%20%20%20%20%20%20%20%20%20%20%20%3fobservationY%20%3fpropertyRefAreaY%20%3frefAreaY%20.%0a%20%20%20%20%20%20%20%20%20%20%20%20%3fpropertyMeasureY%20rdfs%3asubPropertyOf*%20sdmx-measure%3aobsValue%20.%0a%20%20%20%20%20%20%20%20%20%20%20%20%3fobservationY%20%3fpropertyMeasureY%20%3fy%20.%0a%0a%20%20%20%20%20%20%20%20%20%20%20%20%3chttp%3a%2f%2ftransparency.270a.info%2fdataset%2fCPI2009%3e%20qb%3astructure%2fstats%3aidentityDimension%20%3fpropertyIdentityY%20.%0a%20%20%20%20%20%20%20%20%20%20%20%20%3fobservationY%20%3fpropertyIdentityY%20%3fidentityY%20.%0a%0a%20%20%20%20%20%20%20%20%20%20%20%20OPTIONAL%20%7b%0a%20%20%20%20%20%20%20%20%20%20%20%20%20%20%20%20%3frefAreaY%20skos%3aexactMatch%20%3frefAreaYExactMatch%20.%0a%20%20%20%20%20%20%20%20%20%20%20%20%20%20%20%20FILTER%20(REGEX(STR(%3frefAreaYExactMatch),%20%22%5ehttp%3a%2f%2fworldbank.270a.info%2f%22))%0a%20%20%20%20%20%20%20%20%20%20%20%20%7d%0a%0a%20%20%20%20%20%20%20%20%20%20%20%20%3frefAreaY%20skos%3anotation%20%3frefAreaCodeY%20.%0a%20%20%20%20%20%20%20%20%20%20%20%20FILTER%20(!REGEX(%3frefAreaCodeY,%20%22%5e%5b0-9%5d%22))%0a%23%20%20%20%20%20%20%20%20%20%20%20%20FILTER%20(DATATYPE(%3fy)%20%3d%20xsd%3adecimal%20%7c%7c%20DATATYPE(%3fy)%20%3d%20xsd%3adouble)%0a%20%20%20%20%20%20%20%20%7d%0a%20%20%20%20%7d%0a%20%20%20%20FILTER%20(%3frefAreaYExactMatch%20%3d%20%3frefAreaX%20%7c%7c%20%3frefAreaXExactMatch%20%3d%20%3frefAreaY%20%7c%7c%20%3frefAreaY%20%3d%20%3frefAreaX)%0a%7d%0aORDER%20BY%20%3fidentityY%20%3fidentityX%20%3fx%20%3fy%0a
Sarven Capadisli replied on
+Kingsley Idehen The point here is that, if you are not a developer, you don't need to worry about any of this. Drop-down is your friend.BTW, everytime a "new" analysis is made, it gets written to store. There are way too many combinations to bother with to pre-populate the store. So, I'm letting the users do it themselves. It will also be a good indication to see what's interesting enough (some comparisons might not be worthwhile). Although, for that someting like that, I probably have to add a counter for it.The example I used is actually not that interesting i.e., the corruption score is probably not increasing as mortality rate increases. At least thats not something a real stats / journalist person would find interesting or have any real meaning.There is still a lot of work to be done.
Kingsley Idehen replied on
I just want to have a simple example that imports the data used to plot your graph into a Google Spreadsheet using a SPARQL-PROTOCOL URL (i.e., output of SPARQL Query in CSV format). Then you can have a plotted graph in HTML that matches what's in the Google Spreadsheet. In both cases, all the data items (where applicable) are denoted using Linked Data URIs. This is a simple demonstration of Data De-Silo-Fication via Linked Data :-)#LinkedData #SemanticWeb #BigData #OpenData #SmartData
Sarven Capadisli replied on
Just add "&output=csv" at the end of the SPARQL URL.No centralisation intended. If there is a blocker, let me know and I'll make sure that you can get the data out or be able to refer to it. You have access to the full endpoint as I do.http://stats.270a.info/analysis/worldbank:SP.DYN.IMRT.IN/transparency:CPI2009/year:2009 contains the analysis itself.The SPARQL URL above is what gathers the data from different sources in real-time. That data is stored here for future use:http://stats.270a.info/analysis/worldbank:SP.DYN.IMRT.IN/transparency:CPI2009/year:2009 stats:data [ ?p ?o ]So that if http://stats.270a.info/analysis/worldbank:SP.DYN.IMRT.IN/transparency:CPI2009/year:2009 exists, there is no need to go out and redo the federated query. Unless of course there are bugs or things need to be flushed, I'll remove them in that case and simply reload the URI on the Web UI.
Kingsley Idehen replied on
+Sarven Capadisli -- I'll make time to play around a little. Key thing is to have a nice demo that showcases this kind of de-silo-fication :-)
Anonymous Reviewer replied on
The work presented in this paper attempts to present an approach based on Linked Data principles to publish and consume statistical data by use of federated queries, to enable an easy analysis and visualizations of multi-dimensional statistical data. One way of helping the users to understand the underlying data is through visualizations.
This paper fits very well the purpose of this workshop as it shows how statistical publishers can integrate and analyze data published in different endpoints, and can still use the well-known R language for making more analysis with semantic data. However, some questions and suggestions could help the authors to better shape their contribution.
Detailed comments, in the order of the text:
You use the term "layperson", that sounds somehow not appropriate. Could it be possible to find another name, e.g. "non-IT people " ?
In the abstract, s/normalizes/is used to describe ..
You use the package R for visualization, could it be possible to have the same results with some other existing tools of visualization? If yes, explain better the motivation of using R package.
In the Introduction, It could be nice to have some percentage of statistical datasets in the LOD Cloud. And even where can we find statistical data on the LOD?
Section 2: It is not clear to the reader what is the relationship and/or difference between Data Cube and SDMX-RDF. I suggest to rephrase the sentence "The RDF Data Cube vocabulary is ...(..) models".
You say "Linked SDMX Data provided an automated approach...". Is it a tool, a process or the result of a workflow? What do you define mean by "high-fidelity statistical datasets"? Be more specific.
Section 3: Define what are "Dependent variables" and "independent variables" and why are they important in the datasets, as well as in your interface.
Subsection 4.1: s/Requirements/ Functional Requirements? or Technical Requirements?
Subsection 4.2: How many types of charts are available for visualizations? You provide also data in .csv, why not integrating other formats (.e.g.: turtle, n3, RDF/XML) ?
The resolution of Figure 1 is not very good.
Subsection 4.3: Provide a reference or link to the integrity constraints of the DQ vocabulary. s/well-formed/consistent with its semantic !?
You use LIMES for interlinking, any motivation for choosing this tool, instead of any other similar tool for interlinking? Maybe a short justification could be relevant for the readers.
In section 4.5, it seems to me that many datasets (e.g. World Bank, ECB, ) where created y/or curated by the authors of the paper. So, they do have previous knowledge on those datasets. What efforts could be done for replicating this process without prior knowledge of the datasets?
In P.8, what if you use DCAT vocabulary instead of VoID? When you say "As datasets are multi-dimensional", you mean before they are converted into RDF? Be more precise here.
You use GDP for the first time without defining it.
In section 4.8, remove duplicated XSD. s/RDF /RDF, Looking at stats vocab, it seems strange that you don't reuse any other vocabularies out there on the wild. One could have expected some equivalences with some SIO elements, e.g: sio:bar or sio:plot (see: https://code.google.com/p/semanticscience/wiki/ODPStatisticalGraph). But instead, you mention the use of SIO as a future plan. Why this choice in the designing process of the vocabulary?
In Page 10, reference s/[38]/[41].
In general, double check references numbers: from [38] to [41].
In the Conclusions, rephrase "As the Linked Data approach allows one to explore resources from one thing to another", maybe just s/thing/item, resource?
We highly recommend the authors to triple check the consistency of the entries in the References section, as well as providing precise details to some of them.
Anonymous Reviewer replied on
Interesting approach with state-of-the art techniques. Therefore an accept.
Some areas of the paper could be improved by a more balanced description of concepts, approaches, methods, and results.
Here are some details:
- First paragraph of introduction too general, could be shortened. The resulting space could be used on parts which are more focused on the scope of the paper.
- Some evaluation of the related work (good overview) and the relationship to the work described in this paper could be added.
- Purpose of 270a.info should be described at first occurence.
- Data Cube as "the most fundamental work". Not clear in what sense. Also, there seem to be other approaches as well.
- Review the wording of "analysis", sometimes it should be plural (analyses), singular, or sometimes analysis results.
- The critical discussion of matching of data concepts should be improved. This is key for the overall approach. Possible limitations, possible strengths on the conceptual and technical level.
- Review wording regarding statistical domain. Example: a statistical observation is an observation on an unit (i.e. person). This is not what Data Cube describes. The distinction between aggregated data/macrodata (metadata specs Data Cube, SDMX) and unit record data/microdata (for example metadata spec DDI-RDF Discovery/DDI) is not explained nor a reference to an explanation included.
- The overview of the approach in this paper should be described in depth in the beginning of section 4. Currently there are just 4 lines.
- Resolution quality of figure 1 is poor, should be improved.
- stats.270a.info/vocab: not really clear why an own approach is necessary. The argument "more complex" doesn't seem to justify the creation of a new vocab.
- Conclusion: this could be clearer structured and improved. Strengths, limitations, and possible future works should be clear described for the overall conceptual approach and for the used technical means.
- Is a reference to a description of the R language missing?
Anonymous Reviewer replied on
This is an interesting paper with a good list of related tools, a slick demo at http://stats.270a.info/ (oh yeah) in an environment (Shiny Studio) used by statisticians with examples where the performances do require some tuning.
I would have liked to see more information on the expected compliance to the RDF Data Cube specification (the Integrity Constraints). Does the tool used the slices, the DSD ...?
The remark on the need to substitute the REGEX filters by named graphs information sourced from the void:Dataset is useful.
The only concern is the URI Pattern in 4.7
The suggestion to use URI {prefix}:{concept} snippets is maybe one step too far: it would required a universally accepted mechanisms to access the prefix definitions.
Linked Open Data URIs should pass Vapour http://idi.fundacionctic.org/vapour).
Finally, if the tool is designed to be used by data journalisms, then extra advice/support to help the journalist to judge/check the relevance of statistical method for a particular task should be provided.
Please fix:
In 4.5 (beginning): sentences are a bit too long.
Since one of the requirements was to ensure that the concepts are interlinked at either one of the endpoints (in which case, it is optional per endpoint), each endpoint had to include each observation's reference area as well as its interlinked concept, if any in the result set. The result from both endpoints was first joined and then filtered in order to avoid false negatives i.e., either conceptx has a skos:exactMatch relationship to concepty, or vice versa, or conceptx and concepty are the same.
In 6. : Making stats.opt (not sure what stats.opt is)
References:
- the links to papers ratio is a bit high (maybe use footnotes for links).
If there is some space left for some extra references, here are other relevant work:
- http://alangrafu.github.io/visualbox/
- http://code-research.eu/wp-content/uploads/2013/02/D4.1-Semantic-Descriptions-for-Visual-Analytics-Components.pdf (some commonalities with http://stats.270a.info/analysis/ ?)
Ricardo Pietrobon replied on
+Sarven Capadisli and +Kingsley Idehen , here is an initial demo that +Mailson Santos has put together: http://goo.gl/pdYZdn . graphics are based on http://goo.gl/zDFRM we will be deploying this to a server soon, also preparing some other analyses and a peer-reviewed paper specifically targeting education policy makers, and so using more specific subsets of the data. Sarven, would be outstanding to have you in the paper if you might be interested, we should have a very initial draft by this coming weekend+Elias Carvalho +Joao Ricardo Nickenig Vissoci +Jacson Barros
Sarven Capadisli replied on
Great to see the data being used as such! Sure, let me know by email how I can contribute to the paper.
Ricardo Pietrobon replied on
cool, let me finish this rough draft and then will send your way